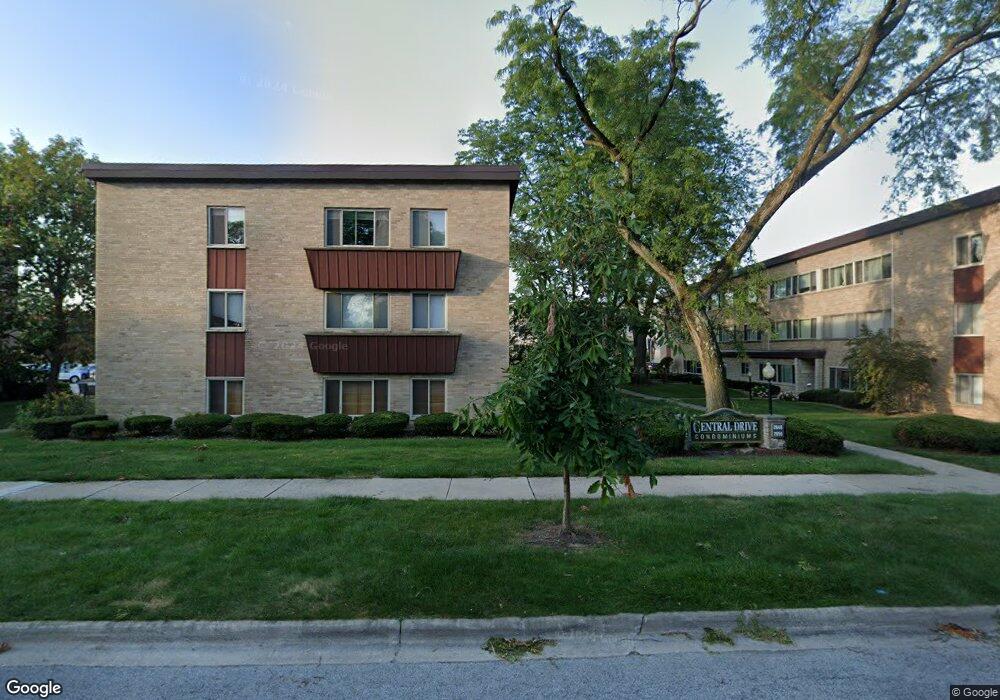
2642 Central Dr Unit 2642GS Flossmoor, IL 60422
Estimated Value: $159,000 - $166,024
--
Bed
--
Bath
16,002
Sq Ft
$10/Sq Ft
Est. Value
About This Home
This home is located at 2642 Central Dr Unit 2642GS, Flossmoor, IL 60422 and is currently estimated at $163,506, approximately $10 per square foot. 2642 Central Dr Unit 2642GS is a home located in Cook County with nearby schools including Western Avenue Elementary School, Parker Junior High School, and Homewood-Flossmoor High School.
Ownership History
Date
Name
Owned For
Owner Type
Purchase Details
Closed on
Jun 29, 2022
Sold by
Hampton Sarit
Bought by
Kwaza Ayana
Current Estimated Value
Home Financials for this Owner
Home Financials are based on the most recent Mortgage that was taken out on this home.
Original Mortgage
$147,283
Outstanding Balance
$139,700
Interest Rate
4.75%
Mortgage Type
FHA
Estimated Equity
$23,806
Purchase Details
Closed on
Mar 10, 2022
Sold by
Nicholas Robert E and Eula H Nicholas Trust
Bought by
Hampton Sarit
Purchase Details
Closed on
Feb 9, 2022
Sold by
Nicholas Robert E and Eula H Nicholas Trust
Bought by
Hampton Sarit
Purchase Details
Closed on
Mar 6, 2000
Sold by
Sundstrom Ruth S
Bought by
Eula H Nichols Trust
Purchase Details
Closed on
Oct 15, 1997
Sold by
Sundstrom Ruth S
Bought by
The Ruth S Sundstrom Trust
Create a Home Valuation Report for This Property
The Home Valuation Report is an in-depth analysis detailing your home's value as well as a comparison with similar homes in the area
Home Values in the Area
Average Home Value in this Area
Purchase History
| Date | Buyer | Sale Price | Title Company |
|---|---|---|---|
| Kwaza Ayana | $150,000 | Citywide Title | |
| Hampton Sarit | $115,000 | -- | |
| Hampton Sarit | $115,000 | -- | |
| Eula H Nichols Trust | -- | -- | |
| The Ruth S Sundstrom Trust | -- | -- |
Source: Public Records
Mortgage History
| Date | Status | Borrower | Loan Amount |
|---|---|---|---|
| Open | Kwaza Ayana | $147,283 |
Source: Public Records
Tax History Compared to Growth
Tax History
| Year | Tax Paid | Tax Assessment Tax Assessment Total Assessment is a certain percentage of the fair market value that is determined by local assessors to be the total taxable value of land and additions on the property. | Land | Improvement |
|---|---|---|---|---|
| 2024 | $4,724 | $11,100 | $953 | $10,147 |
| 2023 | $3,822 | $11,100 | $953 | $10,147 |
| 2022 | $3,822 | $7,106 | $1,126 | $5,980 |
| 2021 | $3,829 | $7,106 | $1,126 | $5,980 |
| 2020 | $785 | $7,106 | $1,126 | $5,980 |
| 2019 | $1,291 | $5,825 | $1,082 | $4,743 |
| 2018 | $3,021 | $5,825 | $1,082 | $4,743 |
| 2017 | $425 | $5,825 | $1,082 | $4,743 |
| 2016 | $3,040 | $5,740 | $1,039 | $4,701 |
| 2015 | $3,055 | $5,740 | $1,039 | $4,701 |
| 2014 | $2,997 | $5,740 | $1,039 | $4,701 |
| 2013 | $1,693 | $8,051 | $1,039 | $7,012 |
Source: Public Records
Map
Nearby Homes
- 2640 Central Dr Unit 1-N
- 1117 Leavitt Ave Unit 110
- 2633 Hawthorne Ln Unit B
- 1139 Leavitt Ave Unit 212
- 1139 Leavitt Ave Unit 313
- 1141 Leavitt Ave Unit 115
- 2817 Flossmoor Rd
- 846 Park Dr
- 926 Braemar Rd
- 802 Argyle Ave
- 2929 Flossmoor Rd
- 1248 Oakmont Ave
- 2931 Sunset Ave
- 950 Gardner Rd
- 1248 Berry Ln
- 710 Bruce Ave
- 3037 Candlewood Ct
- 1402 Berry Ln
- 1430 Brassie Ave
- 1418 Western Ave
- 2642 Central Dr Unit 1S
- 2642 Central Dr Unit 2642GN
- 2642 Central Dr Unit 26421N
- 2642 Central Dr Unit 26422N
- 2642 Central Dr Unit 26421S
- 2642 Central Dr Unit 26422S
- 2642 Central Dr Unit GS
- 2642 Central Dr Unit 2N
- 2642 Central Dr Unit 1N
- 2642 Central Dr Unit GN
- 2640 Central Dr Unit 26401S
- 2640 Central Dr Unit 26402N
- 2640 Central Dr Unit 2640GN
- 2640 Central Dr Unit 26402S
- 2640 Central Dr Unit 26401N
- 2640 Central Dr Unit 2N
- 2640 Central Dr Unit 1S
- 2650 Central Dr Unit 26502S
- 2650 Central Dr Unit 26501S
- 2650 Central Dr Unit 2650GS