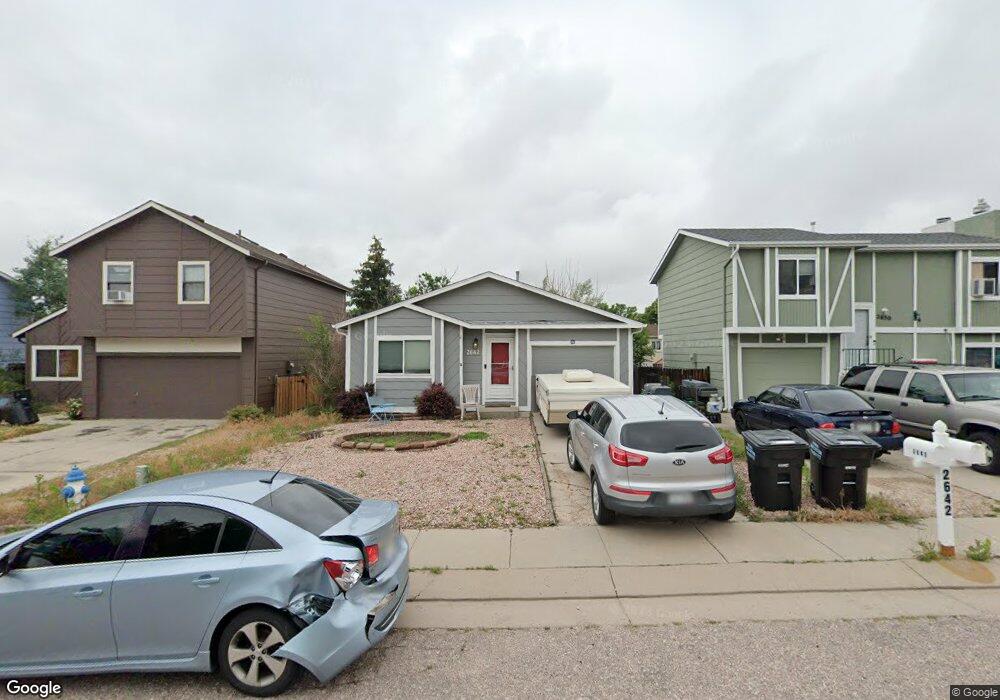
2642 Manassas Way Colorado Springs, CO 80922
Estimated Value: $321,697 - $352,000
2
Beds
1
Bath
1,656
Sq Ft
$206/Sq Ft
Est. Value
About This Home
This home is located at 2642 Manassas Way, Colorado Springs, CO 80922 and is currently estimated at $341,674, approximately $206 per square foot. 2642 Manassas Way is a home located in El Paso County with nearby schools including Remington Elementary School, Horizon Middle School, and Sand Creek High School.
Ownership History
Date
Name
Owned For
Owner Type
Purchase Details
Closed on
Apr 4, 2019
Sold by
Potter John S and Potter Linda M
Bought by
Smith Stephanie and Jenkins Travis
Current Estimated Value
Home Financials for this Owner
Home Financials are based on the most recent Mortgage that was taken out on this home.
Original Mortgage
$216,015
Outstanding Balance
$192,692
Interest Rate
5.25%
Mortgage Type
FHA
Estimated Equity
$148,982
Purchase Details
Closed on
Oct 23, 1997
Sold by
Franks Michael D and Franks Diane L
Bought by
Potter John S and Potter Linda M
Home Financials for this Owner
Home Financials are based on the most recent Mortgage that was taken out on this home.
Original Mortgage
$107,810
Interest Rate
7.52%
Mortgage Type
FHA
Purchase Details
Closed on
Aug 1, 1986
Bought by
Potter Michael C
Create a Home Valuation Report for This Property
The Home Valuation Report is an in-depth analysis detailing your home's value as well as a comparison with similar homes in the area
Home Values in the Area
Average Home Value in this Area
Purchase History
| Date | Buyer | Sale Price | Title Company |
|---|---|---|---|
| Smith Stephanie | $220,000 | Land Title Guarantee Co | |
| Potter John S | $108,500 | North American Title | |
| Potter Michael C | -- | -- |
Source: Public Records
Mortgage History
| Date | Status | Borrower | Loan Amount |
|---|---|---|---|
| Open | Smith Stephanie | $216,015 | |
| Previous Owner | Potter John S | $107,810 |
Source: Public Records
Tax History Compared to Growth
Tax History
| Year | Tax Paid | Tax Assessment Tax Assessment Total Assessment is a certain percentage of the fair market value that is determined by local assessors to be the total taxable value of land and additions on the property. | Land | Improvement |
|---|---|---|---|---|
| 2025 | $1,447 | $23,830 | -- | -- |
| 2024 | $1,345 | $24,100 | $3,700 | $20,400 |
| 2023 | $1,345 | $24,100 | $3,700 | $20,400 |
| 2022 | $1,171 | $16,710 | $3,340 | $13,370 |
| 2021 | $1,212 | $17,190 | $3,430 | $13,760 |
| 2020 | $923 | $13,040 | $2,860 | $10,180 |
| 2019 | $915 | $13,040 | $2,860 | $10,180 |
| 2018 | $720 | $10,100 | $2,420 | $7,680 |
| 2017 | $723 | $10,100 | $2,420 | $7,680 |
| 2016 | $732 | $10,220 | $2,360 | $7,860 |
| 2015 | $732 | $10,220 | $2,360 | $7,860 |
| 2014 | $700 | $9,600 | $2,230 | $7,370 |
Source: Public Records
Map
Nearby Homes
- 2650 Fredricksburg Dr
- 6348 Zermatt Dr
- 6382 Zermatt Dr
- 2406 Rocklin Dr
- 6420 Mohican Dr
- 2845 Leoti Dr
- 2945 Haystack Dr
- 6545 Lindal Dr
- 1625 Piros Dr
- 2840 Frazier Ln
- 2360 Allyn Way
- 2240 Lisa Dr
- 2185 Ambleside Dr
- 3032 Pony Tracks Dr
- 3175 Ox Cart Dr
- 3265 Leoti Dr
- 3052 Curly Grove
- 2535 Canada Dr
- Primrose Plan at Pony Park
- Clover Plan at Pony Park
- 2650 Manassas Way
- 2634 Manassas Way
- 6365 Chantilly Place
- 2658 Manassas Way
- 2626 Manassas Way
- 6375 Chantilly Place
- 6345 Chantilly Place
- 6405 Chantilly Place
- 2666 Manassas Way
- 2641 Manassas Way
- 2633 Manassas Way
- 6415 Chantilly Place
- 6325 Chantilly Place
- 2649 Manassas Way
- 2625 Manassas Way
- 2674 Manassas Way
- 2657 Manassas Way
- 2617 Manassas Way
- 2610 Manassas Way
- 6425 Chantilly Place