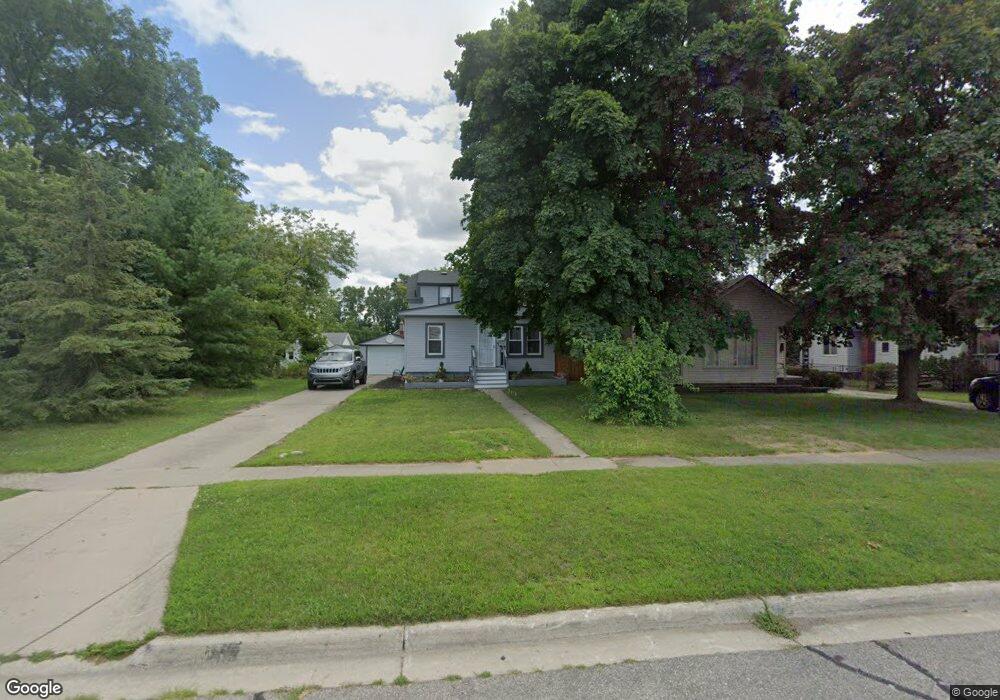
26423 Kean St Inkster, MI 48141
Estimated Value: $89,000 - $140,000
3
Beds
1
Bath
1,104
Sq Ft
$106/Sq Ft
Est. Value
About This Home
This home is located at 26423 Kean St, Inkster, MI 48141 and is currently estimated at $116,548, approximately $105 per square foot. 26423 Kean St is a home located in Wayne County with nearby schools including Inkster Preparatory Academy, American International Academy - Elementary, and Peterson-Warren Academy.
Ownership History
Date
Name
Owned For
Owner Type
Purchase Details
Closed on
Sep 12, 2021
Sold by
Mgc Properties Inc
Bought by
Dillard Homes Realty Llc
Current Estimated Value
Purchase Details
Closed on
Apr 2, 2019
Sold by
Moore Tracey
Bought by
Mgc Properties Inc
Purchase Details
Closed on
Feb 28, 2018
Sold by
Mgc Properties Inc
Bought by
Moore Tracey
Purchase Details
Closed on
Dec 3, 2012
Sold by
Big Dream Llc
Bought by
Mgc Properties Inc
Purchase Details
Closed on
Mar 21, 2012
Sold by
Wojtowicz Raymond J
Bought by
Big Dream Llc
Purchase Details
Closed on
Nov 16, 2007
Sold by
Residential Funding Co Llc
Bought by
Holliman Anthony L
Purchase Details
Closed on
Jun 13, 2007
Sold by
Mccullough Warnedia
Bought by
Residential Funding Co Llc
Purchase Details
Closed on
Dec 13, 2006
Sold by
Stubbs Lavangie D
Bought by
Mccullough Warnedia
Create a Home Valuation Report for This Property
The Home Valuation Report is an in-depth analysis detailing your home's value as well as a comparison with similar homes in the area
Home Values in the Area
Average Home Value in this Area
Purchase History
| Date | Buyer | Sale Price | Title Company |
|---|---|---|---|
| Dillard Homes Realty Llc | $5,000 | None Available | |
| Mgc Properties Inc | $250 | None Available | |
| Moore Tracey | -- | None Available | |
| Mgc Properties Inc | $250 | None Available | |
| Big Dream Llc | $500 | None Available | |
| Holliman Anthony L | $15,000 | Attorneys Title Agency Llc | |
| Residential Funding Co Llc | $45,000 | None Available | |
| Mccullough Warnedia | $80,000 | Lts Title Agency |
Source: Public Records
Tax History Compared to Growth
Tax History
| Year | Tax Paid | Tax Assessment Tax Assessment Total Assessment is a certain percentage of the fair market value that is determined by local assessors to be the total taxable value of land and additions on the property. | Land | Improvement |
|---|---|---|---|---|
| 2025 | $1,681 | $48,900 | $0 | $0 |
| 2024 | $1,681 | $39,400 | $0 | $0 |
| 2023 | $1,575 | $31,400 | $0 | $0 |
| 2022 | $2,159 | $25,100 | $0 | $0 |
| 2021 | $10,509 | $22,700 | $0 | $0 |
| 2020 | $2,975 | $19,200 | $0 | $0 |
| 2019 | $1,232 | $16,500 | $0 | $0 |
| 2018 | $1,168 | $15,500 | $0 | $0 |
| 2017 | $1,010 | $14,900 | $0 | $0 |
| 2016 | $1,740 | $15,200 | $0 | $0 |
| 2015 | $1,440 | $14,400 | $0 | $0 |
| 2013 | $1,810 | $18,100 | $0 | $0 |
| 2012 | $2,227 | $19,900 | $1,500 | $18,400 |
Source: Public Records
Map
Nearby Homes
- 26431 Trowbridge St
- 26620 Oakland St
- 26301 W Hills Dr
- 26281 W Hills Dr
- 26269 Dunning St
- 26736 Oakland St
- 26723 W Hills Dr
- 26280 W Hills Dr
- 26901 Kean St
- 26160 Princeton St
- 26115 Princeton St
- 26669 Norfolk St
- 26703 Norfolk St
- 26566 N River Park Dr
- 25933 Norfolk St
- 25960 Yale St
- 26631 New York St
- 26431 Sunningdale Dr
- 27044 Yale St
- VACANT Florence
- 26429 Kean St
- 26437 Kean St
- 26416 Trowbridge St
- 26424 Trowbridge St
- 26406 Trowbridge St
- 26333 Kean St
- 26432 Trowbridge St
- 26342 Trowbridge St
- 26442 Trowbridge St
- 26332 Trowbridge St
- 26457 Kean St
- 26323 Kean St
- 26450 Trowbridge St
- 26324 Trowbridge St
- 26313 Kean St
- 26316 Trowbridge St
- 26355 Michigan Ave
- 2320 Bayhan St
- 26304 Trowbridge St Unit Bldg-Unit
- 26304 Trowbridge St