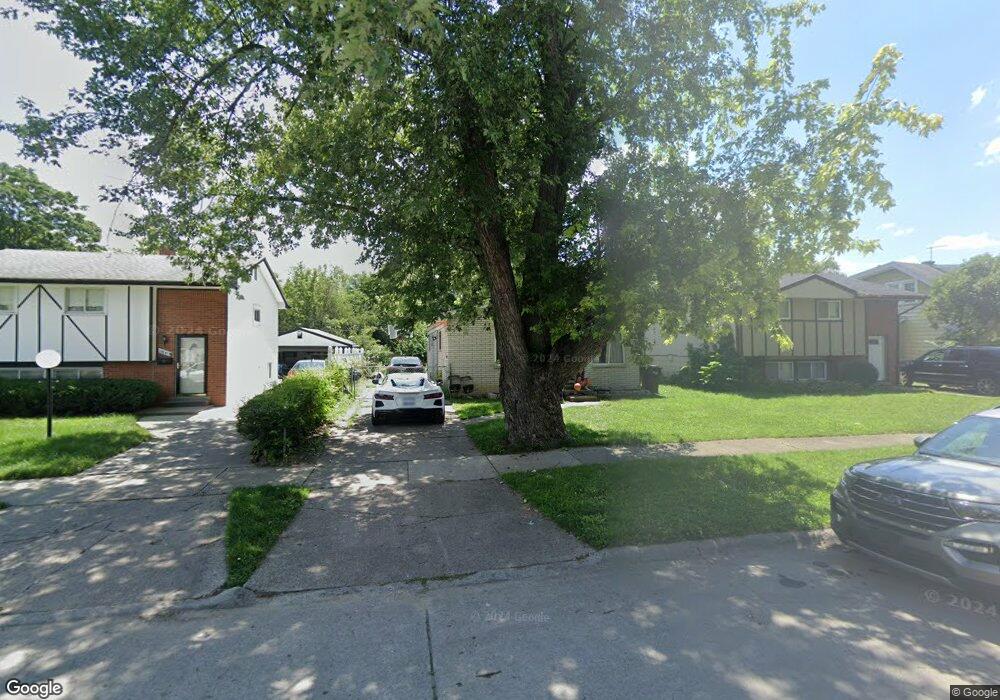
26423 Princeton St Inkster, MI 48141
Estimated Value: $93,000 - $130,000
--
Bed
--
Bath
1,005
Sq Ft
$107/Sq Ft
Est. Value
About This Home
This home is located at 26423 Princeton St, Inkster, MI 48141 and is currently estimated at $107,407, approximately $106 per square foot. 26423 Princeton St is a home located in Wayne County with nearby schools including American International Academy - Elementary, West Village Academy, and Peterson-Warren Academy.
Ownership History
Date
Name
Owned For
Owner Type
Purchase Details
Closed on
Feb 24, 2016
Sold by
Mgc Properties Inc
Bought by
Edwards Shontae Jovonna Elizabeth
Current Estimated Value
Purchase Details
Closed on
Dec 3, 2012
Sold by
Big Dream Llc
Bought by
Mgc Properties Inc
Purchase Details
Closed on
Nov 16, 2012
Sold by
Wayne County Treasurer
Bought by
Big Dream Llc
Purchase Details
Closed on
Jun 20, 2008
Sold by
Deutsche Bank National Trust Company
Bought by
Go Invest Wisely Llc
Purchase Details
Closed on
May 24, 2007
Sold by
Washington Mutual Bank
Bought by
Deutsche Bank National Trust Co and Long Beach Mortgage Loan Trust 2005-2
Purchase Details
Closed on
Feb 1, 2007
Sold by
Butts Ashawnna M
Bought by
Washington Mutual Bank and Long Beach Mortgage Co
Purchase Details
Closed on
Apr 16, 2003
Sold by
Dixon Shirlene
Bought by
Bank One Na
Create a Home Valuation Report for This Property
The Home Valuation Report is an in-depth analysis detailing your home's value as well as a comparison with similar homes in the area
Home Values in the Area
Average Home Value in this Area
Purchase History
| Date | Buyer | Sale Price | Title Company |
|---|---|---|---|
| Edwards Shontae Jovonna Elizabeth | $250 | Attorney | |
| Mgc Properties Inc | $250 | None Available | |
| Big Dream Llc | $987 | None Available | |
| Go Invest Wisely Llc | $3,300 | None Available | |
| Deutsche Bank National Trust Co | -- | None Available | |
| Washington Mutual Bank | $72,379 | None Available | |
| Bank One Na | $47,318 | -- |
Source: Public Records
Tax History Compared to Growth
Tax History
| Year | Tax Paid | Tax Assessment Tax Assessment Total Assessment is a certain percentage of the fair market value that is determined by local assessors to be the total taxable value of land and additions on the property. | Land | Improvement |
|---|---|---|---|---|
| 2025 | $1,037 | $46,900 | $0 | $0 |
| 2024 | $1,037 | $38,600 | $0 | $0 |
| 2023 | $1,004 | $31,400 | $0 | $0 |
| 2022 | $1,297 | $25,600 | $0 | $0 |
| 2021 | $1,374 | $23,100 | $0 | $0 |
| 2020 | $1,340 | $19,900 | $0 | $0 |
| 2019 | $1,284 | $17,300 | $0 | $0 |
| 2018 | $1,729 | $17,100 | $0 | $0 |
| 2017 | $565 | $16,400 | $0 | $0 |
| 2016 | $2,184 | $17,000 | $0 | $0 |
| 2015 | $1,780 | $17,800 | $0 | $0 |
| 2013 | $2,240 | $22,400 | $0 | $0 |
| 2012 | $1,808 | $24,600 | $1,800 | $22,800 |
Source: Public Records
Map
Nearby Homes
- 26669 Norfolk St
- 26703 Norfolk St
- 26631 New York St
- 26269 Dunning St
- 26160 Princeton St
- 26115 Princeton St
- 26431 Trowbridge St
- 25960 Yale St
- 25933 Norfolk St
- 26870 Florence St
- 27044 Yale St
- 26901 Kean St
- 26206 Kitch St
- 27008 Penn St
- 27217 Yale St
- 26419 Carlysle St
- 27018 Kitch St
- 27305 Norfolk St
- 27042 Kitch St
- 26736 Oakland St
- 26415 Princeton St
- 26431 Princeton St
- 26439 Princeton St
- 26349 Princeton St
- 26451 Princeton St
- 26414 Princeton St
- 26432 Norfolk St
- 26448 Norfolk St
- 26448 Norfolk St
- 26337 Princeton St
- 26432 Princeton St
- 26350 Norfolk St
- 26404 Norfolk St
- 26404 Norfolk St
- 26404 Norfolk St
- 26406 Princeton St
- 26342 Norfolk St
- 26348 Princeton St
- 26336 Princeton St
- 26516 Princeton St