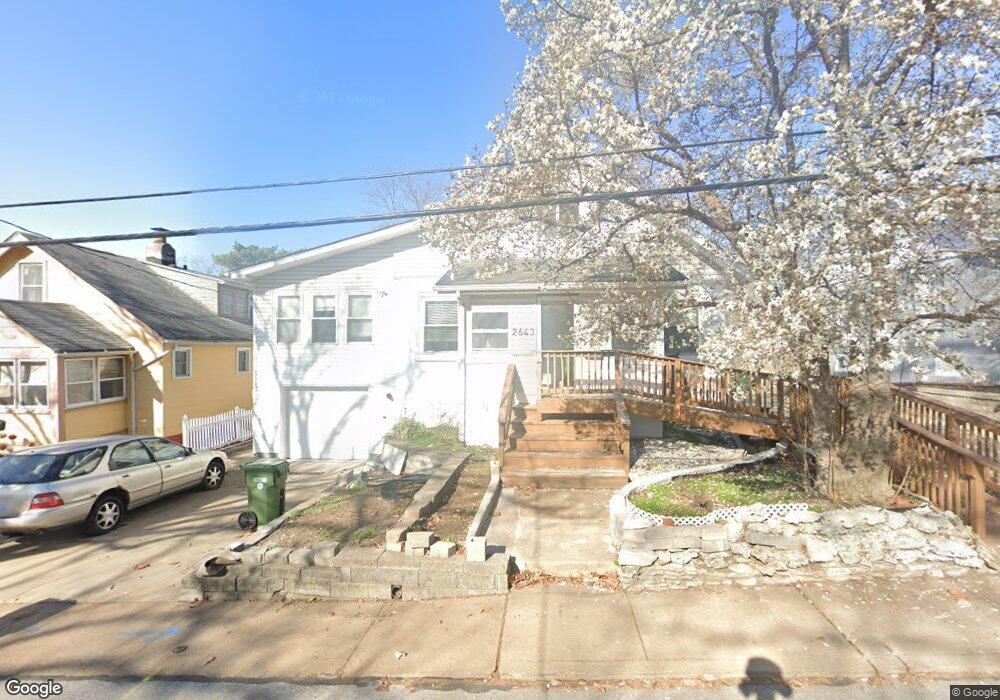
2643 Ruth Ave Saint Louis, MO 63144
Estimated Value: $371,000 - $510,000
2
Beds
3
Baths
2,235
Sq Ft
$201/Sq Ft
Est. Value
About This Home
This home is located at 2643 Ruth Ave, Saint Louis, MO 63144 and is currently estimated at $448,527, approximately $200 per square foot. 2643 Ruth Ave is a home located in St. Louis County with nearby schools including Brentwood High School and St Mary Magdalen School.
Ownership History
Date
Name
Owned For
Owner Type
Purchase Details
Closed on
Jan 23, 2013
Sold by
Federal National Mortgage Association
Bought by
Zhou Zhenqing and Duan Erning
Current Estimated Value
Home Financials for this Owner
Home Financials are based on the most recent Mortgage that was taken out on this home.
Original Mortgage
$104,462
Outstanding Balance
$72,288
Interest Rate
3.42%
Mortgage Type
New Conventional
Estimated Equity
$376,239
Purchase Details
Closed on
Sep 5, 2012
Sold by
Piccinino Carlo and Piccinino Shirley A
Bought by
Onewest Bank Fsb
Purchase Details
Closed on
Mar 19, 1999
Sold by
Carlo Piccinino and Carlo Shirley A
Bought by
Piccinino Carlo and Piccinino Shirley A
Purchase Details
Closed on
Jan 21, 1998
Sold by
Carlo Piccinino and Carlo Shirley A
Bought by
Piccinino Susan and Foster Vera
Create a Home Valuation Report for This Property
The Home Valuation Report is an in-depth analysis detailing your home's value as well as a comparison with similar homes in the area
Home Values in the Area
Average Home Value in this Area
Purchase History
| Date | Buyer | Sale Price | Title Company |
|---|---|---|---|
| Zhou Zhenqing | $130,577 | None Available | |
| Onewest Bank Fsb | $219,851 | None Available | |
| Piccinino Carlo | -- | -- | |
| Piccinino Susan | -- | -- |
Source: Public Records
Mortgage History
| Date | Status | Borrower | Loan Amount |
|---|---|---|---|
| Open | Zhou Zhenqing | $104,462 |
Source: Public Records
Tax History
| Year | Tax Paid | Tax Assessment Tax Assessment Total Assessment is a certain percentage of the fair market value that is determined by local assessors to be the total taxable value of land and additions on the property. | Land | Improvement |
|---|---|---|---|---|
| 2025 | $4,724 | $74,350 | $27,840 | $46,510 |
| 2024 | $4,724 | $68,420 | $22,250 | $46,170 |
| 2023 | $4,594 | $68,420 | $22,250 | $46,170 |
| 2022 | $4,844 | $67,870 | $22,250 | $45,620 |
| 2021 | $4,805 | $67,870 | $22,250 | $45,620 |
| 2020 | $4,030 | $56,260 | $19,490 | $36,770 |
| 2019 | $3,953 | $56,260 | $19,490 | $36,770 |
| 2018 | $3,310 | $42,650 | $14,610 | $28,040 |
| 2017 | $3,231 | $42,650 | $14,610 | $28,040 |
| 2016 | $3,239 | $40,590 | $12,770 | $27,820 |
| 2015 | $3,217 | $40,590 | $12,770 | $27,820 |
| 2014 | $3,537 | $44,540 | $8,930 | $35,610 |
Source: Public Records
Map
Nearby Homes
- 2647 Helen Ave
- 8616 Joseph Ave
- 8737 Magdalen Ave
- 2639 Louis Ave
- 8637 Litzsinger Rd
- 2503 Louis Ave
- 2649 Melvin Ave
- 2905 Brazeau Ave
- 8633 Rosalie Ave
- 2904 Collier Ave
- 2325 Patton Ave
- 2712 Manderly Dr
- 8816 Bridgeport Ave
- 1008 N Bompart Lot C************************* Ave
- 1008 N Bompart Lot B ************** Ave
- 2301 Hilton Ave
- 503 Atalanta Ave
- 8832 Moritz Ave
- 835 N Forest Ave
- 8900 Moritz Ave
- 2647 Ruth Ave
- 2639 Ruth Ave
- 2635 Ruth Ave
- 2651 Ruth Ave
- 2646 Dorothy Ave
- 2650 Dorothy Ave
- 2642 Dorothy Ave
- 2646 Ruth Ave
- 2640 Ruth Ave
- 2654 Dorothy Ave
- 2636 Ruth Ave
- 8600 Florence Ave
- 8612 Florence Ave
- 8608 Florence Ave
- 8616 Florence Ave
- 8518 Florence Ave
- 8620 Florence Ave
- 8515 Manchester Rd
- 85158519 Manchester Rd
- 2641 Helen Ave
Your Personal Tour Guide
Ask me questions while you tour the home.