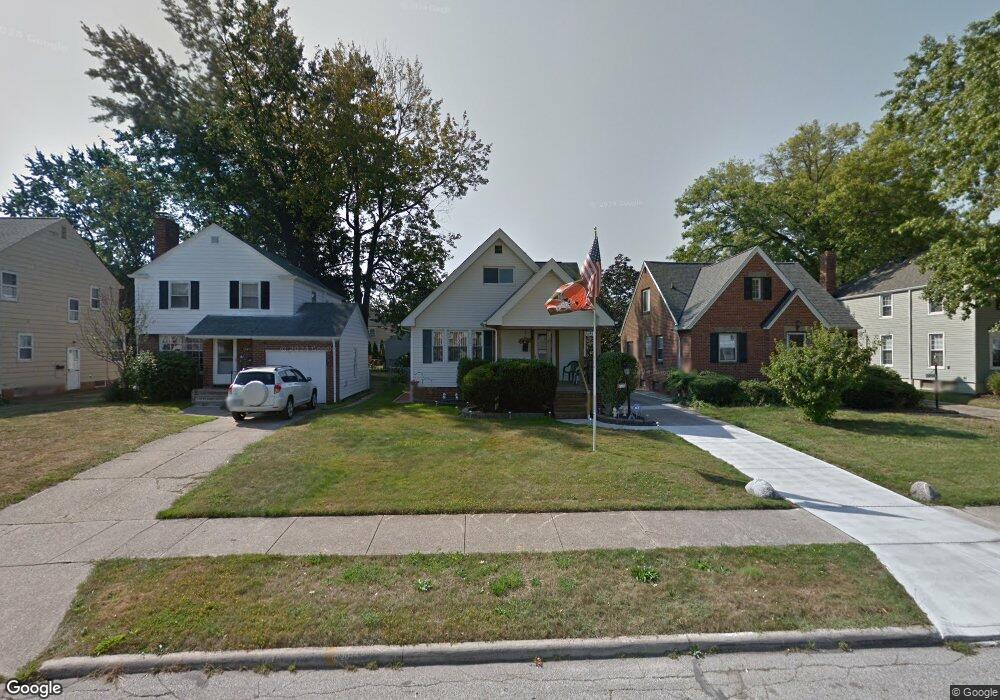
26430 Oriole Ave Euclid, OH 44132
Estimated Value: $132,515 - $158,000
3
Beds
1
Bath
1,312
Sq Ft
$113/Sq Ft
Est. Value
About This Home
This home is located at 26430 Oriole Ave, Euclid, OH 44132 and is currently estimated at $148,879, approximately $113 per square foot. 26430 Oriole Ave is a home located in Cuyahoga County with nearby schools including Shoreview Elementary School, Euclid High School, and Ss. Robert & William Catholic School.
Ownership History
Date
Name
Owned For
Owner Type
Purchase Details
Closed on
Aug 27, 2002
Sold by
Mccloskey Rosemary P
Bought by
Mccloskey Stephen M
Current Estimated Value
Home Financials for this Owner
Home Financials are based on the most recent Mortgage that was taken out on this home.
Original Mortgage
$67,000
Outstanding Balance
$28,600
Interest Rate
6.54%
Estimated Equity
$120,279
Purchase Details
Closed on
Sep 30, 1998
Sold by
Rochford Constance Bieshada
Bought by
Mccloskey Rosemary P
Home Financials for this Owner
Home Financials are based on the most recent Mortgage that was taken out on this home.
Original Mortgage
$69,750
Interest Rate
6.98%
Purchase Details
Closed on
Jul 1, 1992
Sold by
Bieshada Alfred E and Bieshada Kathryn A
Bought by
Bieshada Alfred
Purchase Details
Closed on
Jan 1, 1975
Bought by
Bieshada Alfred E and Bieshada Kathryn A
Create a Home Valuation Report for This Property
The Home Valuation Report is an in-depth analysis detailing your home's value as well as a comparison with similar homes in the area
Home Values in the Area
Average Home Value in this Area
Purchase History
| Date | Buyer | Sale Price | Title Company |
|---|---|---|---|
| Mccloskey Stephen M | $83,800 | -- | |
| Mccloskey Rosemary P | $77,500 | Enterprise Title Agency Inc | |
| Bieshada Alfred | -- | -- | |
| Bieshada Alfred E | -- | -- |
Source: Public Records
Mortgage History
| Date | Status | Borrower | Loan Amount |
|---|---|---|---|
| Open | Mccloskey Stephen M | $67,000 | |
| Closed | Mccloskey Rosemary P | $69,750 |
Source: Public Records
Tax History Compared to Growth
Tax History
| Year | Tax Paid | Tax Assessment Tax Assessment Total Assessment is a certain percentage of the fair market value that is determined by local assessors to be the total taxable value of land and additions on the property. | Land | Improvement |
|---|---|---|---|---|
| 2024 | $3,065 | $44,450 | $8,330 | $36,120 |
| 2023 | $2,672 | $30,770 | $6,340 | $24,430 |
| 2022 | $2,612 | $30,770 | $6,340 | $24,430 |
| 2021 | $2,908 | $30,770 | $6,340 | $24,430 |
| 2020 | $2,759 | $26,530 | $5,460 | $21,070 |
| 2019 | $2,480 | $75,800 | $15,600 | $60,200 |
| 2018 | $2,473 | $26,530 | $5,460 | $21,070 |
| 2017 | $2,649 | $23,460 | $4,520 | $18,940 |
| 2016 | $2,654 | $23,460 | $4,520 | $18,940 |
| 2015 | $5,390 | $23,460 | $4,520 | $18,940 |
| 2014 | $5,390 | $23,460 | $4,520 | $18,940 |
Source: Public Records
Map
Nearby Homes
- 26471 Shoreview Ave
- 26230 Oriole Ave
- 26171 Shoreview Ave
- 405 E 262nd St
- 26471 Farringdon Ave
- 26351 Farringdon Ave
- 415 E 266th St
- 355 E 262nd St
- 27101 Zeman Ave
- 27190 Shoreview Ave
- 635 E 261st St
- 25650 Shoreview Ave
- 440 E 271st St
- 712 E 266th St
- 461 E 271st St
- 325 E 257th St
- 640 E 261st St
- 26430 Drakefield Ave
- 25671 Farringdon Ave
- 327 E 255th St
- 26450 Oriole Ave
- 26400 Oriole Ave
- 26480 Oriole Ave
- 26378 Oriole Ave
- 26500 Oriole Ave
- 26451 Mallard Ave
- 26431 Mallard Ave
- 26461 Mallard Ave
- 26401 Mallard Ave
- 26381 Mallard Ave
- 26530 Oriole Ave
- 26471 Mallard Ave
- 26431 Oriole Ave
- 26451 Oriole Ave
- 26501 Mallard Ave
- 26351 Mallard Ave
- 26401 Oriole Ave
- 26481 Oriole Ave
- 26320 Oriole Ave
- 26550 Oriole Ave