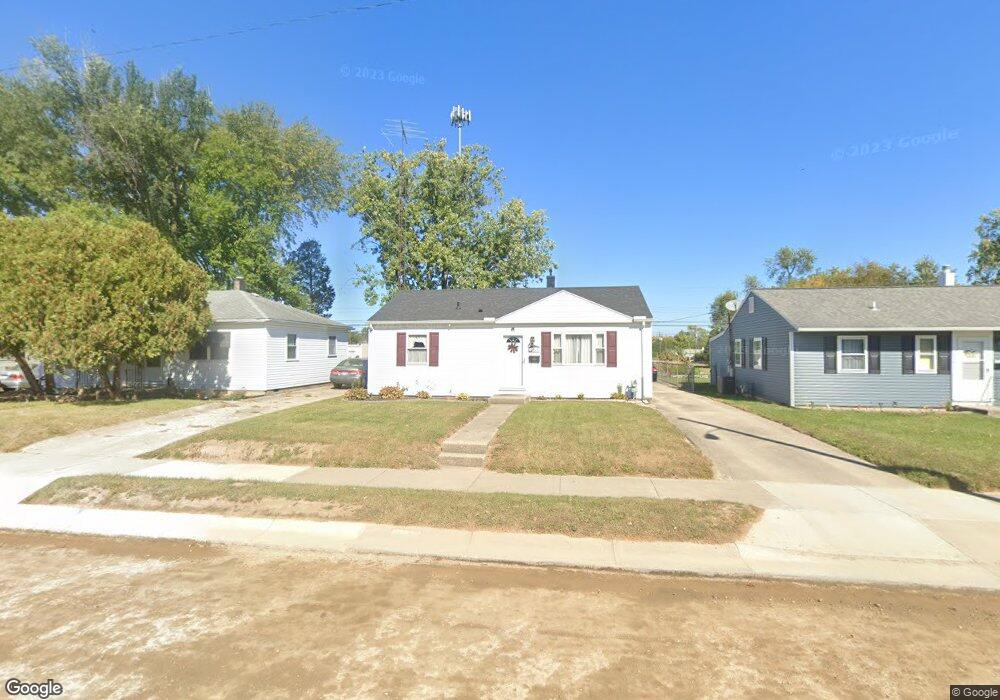
2644 Elmore Dr Springfield, OH 45505
Estimated Value: $135,904 - $156,000
3
Beds
1
Bath
1,146
Sq Ft
$128/Sq Ft
Est. Value
About This Home
This home is located at 2644 Elmore Dr, Springfield, OH 45505 and is currently estimated at $146,476, approximately $127 per square foot. 2644 Elmore Dr is a home located in Clark County with nearby schools including Mann Elementary School, Schaefer Middle School, and Springfield High School.
Ownership History
Date
Name
Owned For
Owner Type
Purchase Details
Closed on
Nov 4, 2013
Sold by
Miller Linda K
Bought by
Brown Terry A and Brown Terry Ann
Current Estimated Value
Home Financials for this Owner
Home Financials are based on the most recent Mortgage that was taken out on this home.
Original Mortgage
$51,120
Outstanding Balance
$37,925
Interest Rate
4.33%
Mortgage Type
New Conventional
Estimated Equity
$108,551
Purchase Details
Closed on
Dec 5, 2005
Sold by
Estate Of Dennis Patrick Miller
Bought by
Miller Linda K
Create a Home Valuation Report for This Property
The Home Valuation Report is an in-depth analysis detailing your home's value as well as a comparison with similar homes in the area
Home Values in the Area
Average Home Value in this Area
Purchase History
| Date | Buyer | Sale Price | Title Company |
|---|---|---|---|
| Brown Terry A | $63,900 | Attorney | |
| Miller Linda K | -- | -- |
Source: Public Records
Mortgage History
| Date | Status | Borrower | Loan Amount |
|---|---|---|---|
| Open | Brown Terry A | $51,120 |
Source: Public Records
Tax History Compared to Growth
Tax History
| Year | Tax Paid | Tax Assessment Tax Assessment Total Assessment is a certain percentage of the fair market value that is determined by local assessors to be the total taxable value of land and additions on the property. | Land | Improvement |
|---|---|---|---|---|
| 2025 | $1,285 | $38,200 | $5,150 | $33,050 |
| 2024 | $1,252 | $25,980 | $4,820 | $21,160 |
| 2023 | $1,252 | $25,980 | $4,820 | $21,160 |
| 2022 | $1,283 | $25,980 | $4,820 | $21,160 |
| 2021 | $1,101 | $20,590 | $3,310 | $17,280 |
| 2020 | $1,103 | $20,590 | $3,310 | $17,280 |
| 2019 | $1,106 | $20,590 | $3,310 | $17,280 |
| 2018 | $1,061 | $18,970 | $2,760 | $16,210 |
| 2017 | $1,060 | $19,961 | $2,758 | $17,203 |
| 2016 | $1,062 | $19,961 | $2,758 | $17,203 |
| 2015 | $1,005 | $18,358 | $2,758 | $15,600 |
| 2014 | $1,001 | $18,358 | $2,758 | $15,600 |
| 2013 | $499 | $18,358 | $2,758 | $15,600 |
Source: Public Records
Map
Nearby Homes
- 2670 Duncan St
- 728 Mavor St
- 1011 Mount Joy St
- 2605 Morton Dr
- 2434 Irwin Ave
- 2345 Irwin Ave
- 360 Buxton Ave
- 374 Raffensperger Ave
- 2560 Kenton St
- 2222 Kenton St
- 400 S Arlington Ave Unit 402
- 3012 E High St
- 3154 Sherwood Park Dr
- 273 S Clairmont Ave
- 138 Lawnview Ave
- 535 S Belmont Ave
- 121 Willis Ave
- 2424-2426 E High St
- 2702 Maplewood Ave
- 2111 Kenilworth Ave