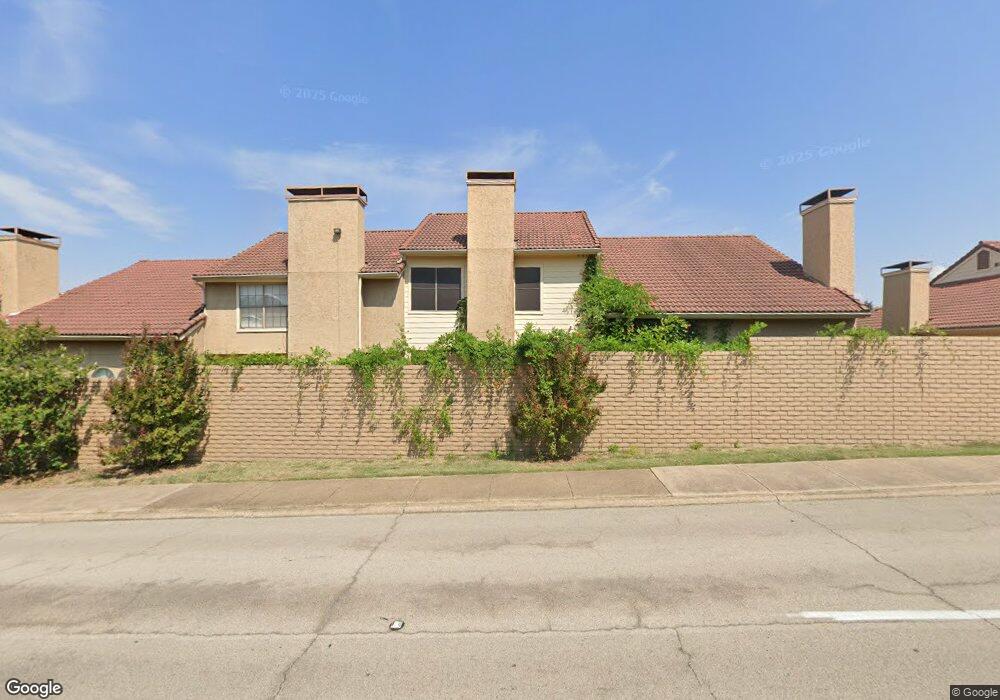
2644 Encina Unit 2 Irving, TX 75038
Las Brisas Hills NeighborhoodEstimated Value: $245,000 - $289,000
2
Beds
2
Baths
1,430
Sq Ft
$186/Sq Ft
Est. Value
About This Home
This home is located at 2644 Encina Unit 2, Irving, TX 75038 and is currently estimated at $266,152, approximately $186 per square foot. 2644 Encina Unit 2 is a home located in Dallas County with nearby schools including Lee Elementary School, Sam Houston Middle School, and Macarthur High School.
Ownership History
Date
Name
Owned For
Owner Type
Purchase Details
Closed on
Nov 30, 2021
Sold by
Le Marino Sue Carole
Bought by
Mohammed Khalid Hassan Alam and Abdalla Salma
Current Estimated Value
Home Financials for this Owner
Home Financials are based on the most recent Mortgage that was taken out on this home.
Original Mortgage
$198,412
Outstanding Balance
$182,438
Interest Rate
3.09%
Mortgage Type
FHA
Estimated Equity
$83,714
Purchase Details
Closed on
Nov 7, 2016
Sold by
Marino Sue Carole
Bought by
Milstead Jan
Purchase Details
Closed on
Sep 20, 2004
Sold by
Wardlow Robert Carol and Wardlow Mary A
Bought by
Marino Sue Carole
Purchase Details
Closed on
Jul 21, 1997
Sold by
Saxton Jerry D
Bought by
Wardlow Robert Carol and Wardlow Mary A
Home Financials for this Owner
Home Financials are based on the most recent Mortgage that was taken out on this home.
Original Mortgage
$79,200
Interest Rate
7.6%
Mortgage Type
FHA
Create a Home Valuation Report for This Property
The Home Valuation Report is an in-depth analysis detailing your home's value as well as a comparison with similar homes in the area
Home Values in the Area
Average Home Value in this Area
Purchase History
| Date | Buyer | Sale Price | Title Company |
|---|---|---|---|
| Mohammed Khalid Hassan Alam | -- | None Listed On Document | |
| Milstead Jan | -- | None Available | |
| Marino Sue Carole | -- | Stnt | |
| Wardlow Robert Carol | -- | -- |
Source: Public Records
Mortgage History
| Date | Status | Borrower | Loan Amount |
|---|---|---|---|
| Open | Mohammed Khalid Hassan Alam | $198,412 | |
| Previous Owner | Wardlow Robert Carol | $79,200 |
Source: Public Records
Tax History Compared to Growth
Tax History
| Year | Tax Paid | Tax Assessment Tax Assessment Total Assessment is a certain percentage of the fair market value that is determined by local assessors to be the total taxable value of land and additions on the property. | Land | Improvement |
|---|---|---|---|---|
| 2025 | $3,198 | $264,550 | $51,300 | $213,250 |
| 2024 | $3,198 | $264,550 | $51,300 | $213,250 |
| 2023 | $3,198 | $200,200 | $51,300 | $148,900 |
| 2022 | $4,617 | $200,200 | $51,300 | $148,900 |
| 2021 | $4,668 | $193,050 | $51,300 | $141,750 |
| 2020 | $4,844 | $193,050 | $51,300 | $141,750 |
| 2019 | $5,309 | $200,200 | $51,300 | $148,900 |
| 2018 | $4,142 | $154,440 | $13,890 | $140,550 |
| 2017 | $3,467 | $128,700 | $13,890 | $114,810 |
| 2016 | $2,966 | $110,110 | $13,890 | $96,220 |
| 2015 | $1,298 | $100,100 | $13,890 | $86,210 |
| 2014 | $1,298 | $92,950 | $13,890 | $79,060 |
Source: Public Records
Map
Nearby Homes
- 2639 Entrada Blvd Unit 3
- 2415 Skyline Dr
- 4245 Madera Rd
- 4222 Nia Dr
- 4220 Madera Rd Unit 2
- 4269 Madera Rd Unit 2
- 4250 Madera Rd Unit 3
- 4252 Madera Rd Unit 2
- 4234 Cuesta Dr
- 4325 Madera Rd
- 4341 Madera Rd
- 2425 W Northgate Dr
- 2513 Briarcliff Dr
- 2344 Southcourt Cir
- 2407 Northlake Ct
- 2604 Burning Tree Ln
- 4419 Westminster Dr
- 3406 Country Club Dr W Unit 272G
- 3404 Country Club Dr W Unit 264
- 3404 Country Club Dr W Unit 162
- 2644 Encina Dr Unit 2
- 2646 Encina Unit 3
- 2642 Encina Unit 1
- 2648 Encina Dr
- 2642 Encina Dr
- 2642 Encina Dr Unit 1
- 2638D Encina Unit 3
- 2638 Encina Unit 3
- 2638 Encina
- 2650 Encina
- 2650 Encina Unit 1
- 2640 Encina Dr Unit 4
- 2636 Encina Unit 2
- 2634 Encina Unit 1
- 2634 Encina
- 2654 Encina Unit 3
- 2629D Encina Unit 2
- 2655 Entrada Blvd Unit 2
- 2655 Entrada Blvd Unit 2
- 2655 Entrada Blvd