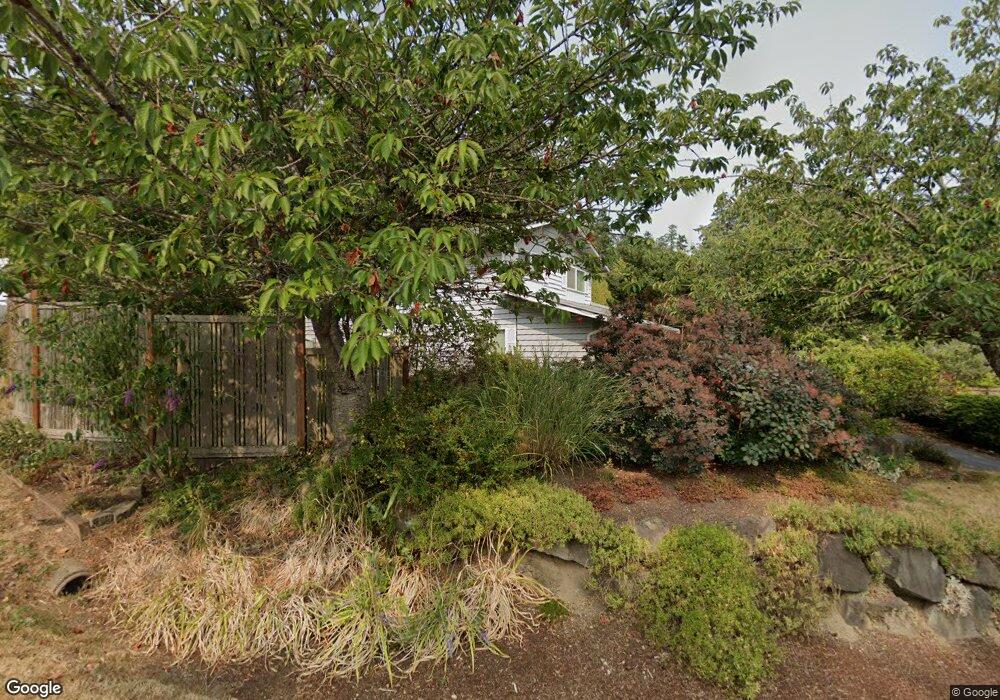
26441 Kingsview Loop NE Kingston, WA 98346
Kingston NeighborhoodEstimated Value: $564,000 - $575,770
3
Beds
2
Baths
1,288
Sq Ft
$443/Sq Ft
Est. Value
About This Home
This home is located at 26441 Kingsview Loop NE, Kingston, WA 98346 and is currently estimated at $569,943, approximately $442 per square foot. 26441 Kingsview Loop NE is a home located in Kitsap County with nearby schools including Richard Gordon Elementary School, Kingston Middle School, and Kingston High School.
Ownership History
Date
Name
Owned For
Owner Type
Purchase Details
Closed on
Aug 1, 2000
Sold by
Wright Gregory T and Wright Colleen H
Bought by
Taylor Eugene and Smoker Lisa
Current Estimated Value
Home Financials for this Owner
Home Financials are based on the most recent Mortgage that was taken out on this home.
Original Mortgage
$152,950
Outstanding Balance
$55,066
Interest Rate
8.12%
Estimated Equity
$514,877
Purchase Details
Closed on
Mar 19, 1996
Sold by
Korst Bernard G D and Korst Mary Beth
Bought by
Wright Gregory T and Wright Colleen H
Home Financials for this Owner
Home Financials are based on the most recent Mortgage that was taken out on this home.
Original Mortgage
$92,800
Interest Rate
7.05%
Mortgage Type
Balloon
Create a Home Valuation Report for This Property
The Home Valuation Report is an in-depth analysis detailing your home's value as well as a comparison with similar homes in the area
Home Values in the Area
Average Home Value in this Area
Purchase History
| Date | Buyer | Sale Price | Title Company |
|---|---|---|---|
| Taylor Eugene | $161,000 | Land Title Company | |
| Wright Gregory T | $116,000 | Land Title Co |
Source: Public Records
Mortgage History
| Date | Status | Borrower | Loan Amount |
|---|---|---|---|
| Open | Taylor Eugene | $152,950 | |
| Previous Owner | Wright Gregory T | $92,800 |
Source: Public Records
Tax History
| Year | Tax Paid | Tax Assessment Tax Assessment Total Assessment is a certain percentage of the fair market value that is determined by local assessors to be the total taxable value of land and additions on the property. | Land | Improvement |
|---|---|---|---|---|
| 2026 | $4,600 | $476,330 | $117,200 | $359,130 |
| 2025 | $4,600 | $498,580 | $104,650 | $393,930 |
| 2024 | $4,451 | $498,580 | $104,650 | $393,930 |
| 2023 | $4,231 | $466,330 | $91,160 | $375,170 |
| 2022 | $3,717 | $388,400 | $75,760 | $312,640 |
| 2021 | $3,463 | $329,940 | $64,200 | $265,740 |
| 2020 | $3,501 | $329,940 | $64,200 | $265,740 |
| 2019 | $3,061 | $287,600 | $52,760 | $234,840 |
| 2018 | $2,779 | $229,520 | $41,650 | $187,870 |
| 2017 | $2,786 | $229,520 | $41,650 | $187,870 |
| 2016 | $2,607 | $196,640 | $39,670 | $156,970 |
| 2015 | $2,590 | $196,640 | $39,670 | $156,970 |
| 2014 | -- | $187,990 | $39,670 | $148,320 |
| 2013 | -- | $183,300 | $56,800 | $126,500 |
Source: Public Records
Map
Nearby Homes
- 26425 Pennsylvania Ave NE Unit A34
- 26425 Pennsylvania Ave NE Unit 4
- 26425 Pennsylvania Ave NE Unit 14
- 26290 Ohio Ave NE
- 26516 Lindvog Rd NE
- 11518 NE Skyward Loop
- 26787 Red Maple Ln NE
- 10603 NE Kingston Meadows Cir Unit 263
- 10543 NE Kingston Meadows Cir Unit 354
- 25960 Central Ave NE
- 0 XXXX NE State Highway 104
- 10686 NE Dawson Way
- 26376 NE Barrett Rd
- 26009 NE Barrett Rd
- 0 Barber Cut Off Rd NE
- 27661 Mcintosh Loop NE
- 10295 NE West Kingston Rd
- 25681 School House Place NE
- 27495 Parcells Rd NE
- 24700 Taree Blvd NE
- 26437 Kingsview Loop NE
- 26443 Kingsview Loop NE
- 26435 Kingsview Loop NE
- 26444 Kingsview Loop NE
- 26434 Kingsview Loop NE
- 26427 Kingsview Loop NE
- 26446 Kingsview Loop NE
- 26445 Kingsview Loop NE
- 26429 Kingsview Loop NE
- 26433 Kingsview Loop NE
- 26431 Kingsview Loop NE
- 26424 Kingsview Loop NE
- 26447 Kingsview Loop NE
- 26425 Kingsview Loop NE
- 26448 Kingsview Loop NE
- 26472 Kingsview Loop NE
- 26470 Kingsview Loop NE
- 26460 Kingsview Loop NE
- 26423 Kingsview Loop NE
- 26449 Kingsview Loop NE
Your Personal Tour Guide
Ask me questions while you tour the home.