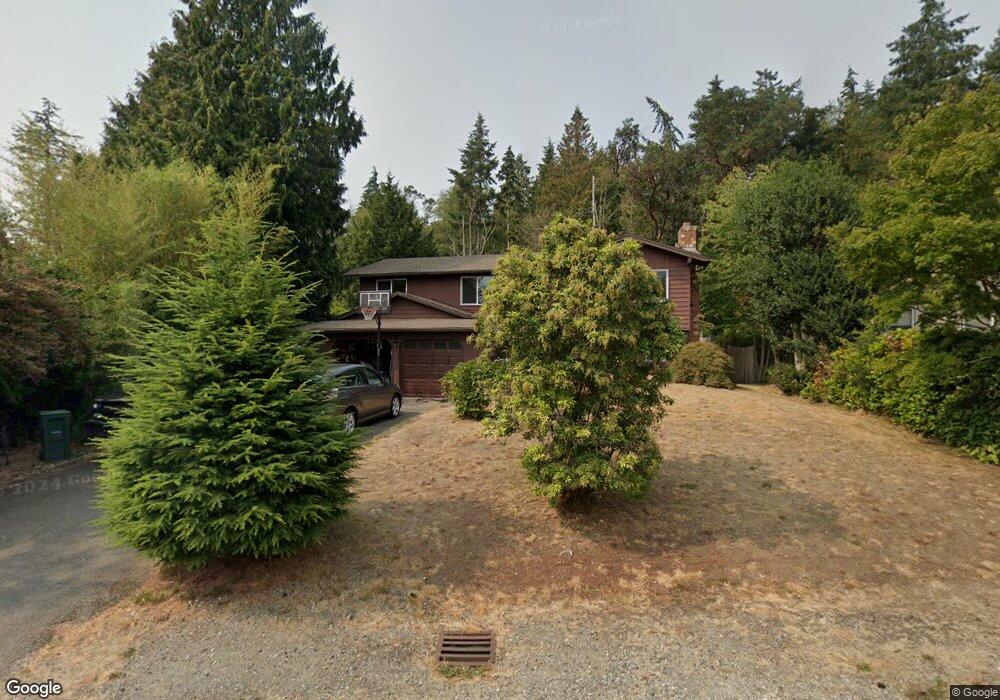
26443 Kingsview Loop NE Kingston, WA 98346
Kingston NeighborhoodEstimated Value: $601,000 - $716,000
3
Beds
2
Baths
1,134
Sq Ft
$575/Sq Ft
Est. Value
About This Home
This home is located at 26443 Kingsview Loop NE, Kingston, WA 98346 and is currently estimated at $651,692, approximately $574 per square foot. 26443 Kingsview Loop NE is a home located in Kitsap County with nearby schools including Richard Gordon Elementary School, Kingston Middle School, and Kingston High School.
Ownership History
Date
Name
Owned For
Owner Type
Purchase Details
Closed on
Mar 28, 2008
Sold by
Fudala John and Fudala Janet B
Bought by
Prendergast Elliott J
Current Estimated Value
Home Financials for this Owner
Home Financials are based on the most recent Mortgage that was taken out on this home.
Original Mortgage
$206,000
Outstanding Balance
$128,781
Interest Rate
5.72%
Mortgage Type
New Conventional
Estimated Equity
$522,911
Create a Home Valuation Report for This Property
The Home Valuation Report is an in-depth analysis detailing your home's value as well as a comparison with similar homes in the area
Home Values in the Area
Average Home Value in this Area
Purchase History
| Date | Buyer | Sale Price | Title Company |
|---|---|---|---|
| Prendergast Elliott J | $206,280 | Transnation Title Ins Co |
Source: Public Records
Mortgage History
| Date | Status | Borrower | Loan Amount |
|---|---|---|---|
| Open | Prendergast Elliott J | $206,000 |
Source: Public Records
Tax History Compared to Growth
Tax History
| Year | Tax Paid | Tax Assessment Tax Assessment Total Assessment is a certain percentage of the fair market value that is determined by local assessors to be the total taxable value of land and additions on the property. | Land | Improvement |
|---|---|---|---|---|
| 2026 | $4,963 | $495,340 | $121,890 | $373,450 |
| 2025 | $4,963 | $539,170 | $108,840 | $430,330 |
| 2024 | $4,803 | $539,170 | $108,840 | $430,330 |
| 2023 | $4,577 | $505,660 | $94,810 | $410,850 |
| 2022 | $4,031 | $422,350 | $78,790 | $343,560 |
| 2021 | $3,757 | $358,970 | $66,770 | $292,200 |
| 2020 | $3,799 | $358,970 | $66,770 | $292,200 |
| 2019 | $3,310 | $311,820 | $54,860 | $256,960 |
| 2018 | $3,003 | $248,880 | $43,310 | $205,570 |
| 2017 | $3,013 | $248,880 | $43,310 | $205,570 |
| 2016 | $2,817 | $213,010 | $41,250 | $171,760 |
| 2015 | $2,798 | $213,010 | $41,250 | $171,760 |
| 2014 | -- | $203,540 | $41,250 | $162,290 |
| 2013 | -- | $202,680 | $59,070 | $143,610 |
Source: Public Records
Map
Nearby Homes
- 26442 Gravity Ave NE
- 26425 Pennsylvania Ave NE Unit A34
- 26516 Lindvog Rd NE
- 26702 Ohio Ave NE
- 26216 Dungeness Ave NE Unit C130
- 25960 Central Ave NE
- 26005 Washington Blvd NE
- 26124 NE James Ln
- 25825 Washington Blvd NE
- 28 xxx NE State Highway 104
- 10809 NE West Kingston Rd
- 0 Barber Cut Off Rd NE
- 10295 NE West Kingston Rd
- 27849 Lindvog Rd NE
- 9643 Goodfellow Ln NE
- 10035 NE Kingston Farm Rd
- 0 Bond Rd NE
- 9590 NE Leprechaun Ln
- 9918 Kingston Farm Rd NE
- 24515 Madura Dr NE
- 26445 Kingsview Loop NE
- 26437 Kingsview Loop NE
- 26441 Kingsview Loop NE
- 26447 Kingsview Loop NE
- 26435 Kingsview Loop NE
- 26446 Kingsview Loop NE
- 26444 Kingsview Loop NE
- 26448 Kingsview Loop NE
- 26449 Kingsview Loop NE
- 26434 Kingsview Loop NE
- 26433 Kingsview Loop NE
- 26427 Kingsview Loop NE
- 26431 Kingsview Loop NE
- 26460 Kingsview Loop NE
- 26429 Kingsview Loop NE
- 26451 Kingsview Loop NE
- 26470 Kingsview Loop NE
- 26424 Kingsview Loop NE
- 26472 Kingsview Loop NE
- 26462 Kingsview Loop NE