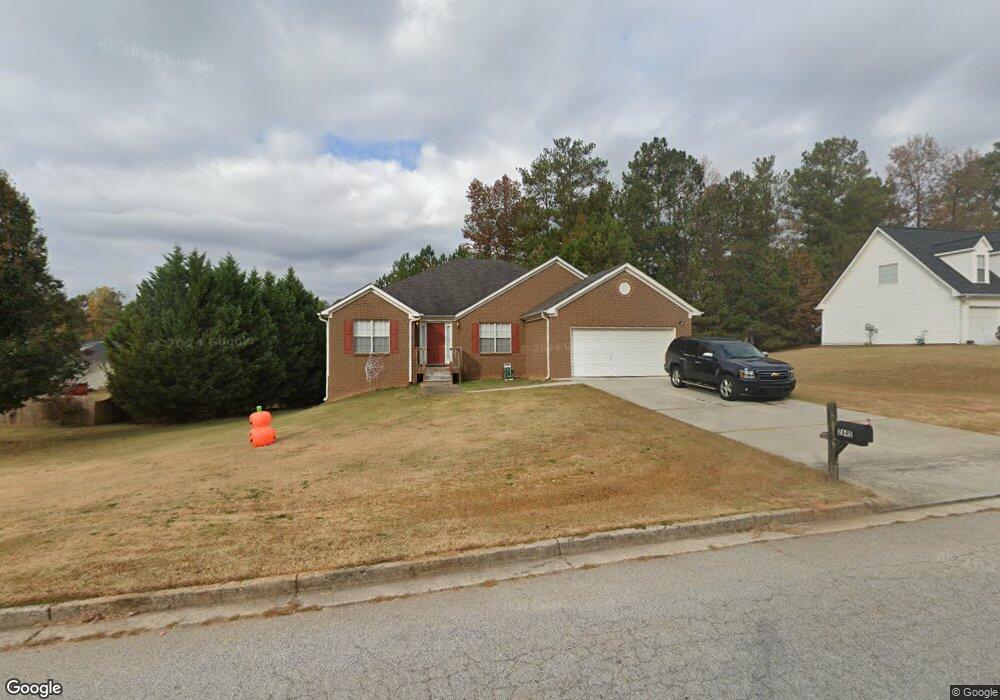
2645 Downing Park Dr SE Conyers, GA 30094
Estimated Value: $323,000 - $387,000
3
Beds
3
Baths
2,126
Sq Ft
$165/Sq Ft
Est. Value
About This Home
This home is located at 2645 Downing Park Dr SE, Conyers, GA 30094 and is currently estimated at $350,525, approximately $164 per square foot. 2645 Downing Park Dr SE is a home located in Rockdale County with nearby schools including Flat Shoals Elementary School, Edwards Middle School, and Salem High School.
Ownership History
Date
Name
Owned For
Owner Type
Purchase Details
Closed on
Mar 27, 2024
Sold by
Boone Derrick C
Bought by
Boone Ansley Johnee and Boone Derrick C
Current Estimated Value
Purchase Details
Closed on
Dec 31, 2019
Sold by
Slaymon Charlie L
Bought by
Boone Derrick C
Home Financials for this Owner
Home Financials are based on the most recent Mortgage that was taken out on this home.
Original Mortgage
$185,000
Interest Rate
3.6%
Mortgage Type
New Conventional
Purchase Details
Closed on
Jun 15, 2006
Sold by
Wayne Thomas Group Inc
Bought by
Slaymon Charlie L
Home Financials for this Owner
Home Financials are based on the most recent Mortgage that was taken out on this home.
Original Mortgage
$191,400
Interest Rate
6.49%
Mortgage Type
New Conventional
Create a Home Valuation Report for This Property
The Home Valuation Report is an in-depth analysis detailing your home's value as well as a comparison with similar homes in the area
Home Values in the Area
Average Home Value in this Area
Purchase History
| Date | Buyer | Sale Price | Title Company |
|---|---|---|---|
| Boone Ansley Johnee | -- | -- | |
| Boone Derrick C | $206,000 | -- | |
| Slaymon Charlie L | $191,400 | -- |
Source: Public Records
Mortgage History
| Date | Status | Borrower | Loan Amount |
|---|---|---|---|
| Previous Owner | Boone Derrick C | $185,000 | |
| Previous Owner | Slaymon Charlie L | $191,400 |
Source: Public Records
Tax History Compared to Growth
Tax History
| Year | Tax Paid | Tax Assessment Tax Assessment Total Assessment is a certain percentage of the fair market value that is determined by local assessors to be the total taxable value of land and additions on the property. | Land | Improvement |
|---|---|---|---|---|
| 2024 | $3,532 | $142,160 | $25,560 | $116,600 |
| 2023 | $3,066 | $128,520 | $24,360 | $104,160 |
| 2022 | $2,922 | $122,880 | $24,360 | $98,520 |
| 2021 | $2,564 | $102,440 | $20,880 | $81,560 |
| 2020 | $3,550 | $82,400 | $18,974 | $63,426 |
| 2019 | $1,690 | $68,720 | $10,920 | $57,800 |
| 2018 | $1,701 | $68,720 | $10,920 | $57,800 |
| 2017 | $1,597 | $64,680 | $10,920 | $53,760 |
| 2016 | $1,476 | $64,680 | $10,920 | $53,760 |
| 2015 | $1,343 | $59,960 | $6,200 | $53,760 |
| 2014 | $1,204 | $59,960 | $6,200 | $53,760 |
| 2013 | -- | $78,560 | $15,480 | $63,080 |
Source: Public Records
Map
Nearby Homes
- 2537 Lennox Rd SE
- 2608 Downing Park Dr SE
- 784 Stieff Ct SE
- 1920 Logan Ln
- 2464 Lennox Rd SE
- 1420 Hillside Place SE
- 1511 Hillside Dr SE
- 2717 Stanton Woods Dr SE
- 1508 Hillside Dr SE
- 917 Curry Cir SE
- 2617 Laurel Woods Ln SE Unit 3
- 574 Almand Branch Rd SE Unit 1
- 693 Deering Rd SE
- 2684 Harvest Dr SE
- Boston Plan at Millers Pointe
- Atlanta Plan at Millers Pointe
- Columbus Plan at Millers Pointe
- 2924 Raintree Dr SE
- 2754 Harvest Dr SE
- 2923 Raintree Dr SE
- 2645 Downing Park SE
- 2641 Downing Park Dr SE
- 2649 Downing Park Dr SE
- 2719 Kinslow Ridge SE
- 2723 Kinslow Ridge SE
- 2653 Downing Park Dr SE
- 2644 Downing Park Dr SE
- 2637 Downing Park Dr SE
- 2715 Kinslow Ridge SE
- 2640 Downing Park Dr SE
- 2648 Downing Park Dr SE
- 2652 Downing Park Dr SE
- 2636 Downing Park Dr SE
- 2711 Kinslow Ridge SE
- 2727 Kinslow Ridge SE
- 2633 Downing Park Dr SE
- 2633 Downing Park Dr SE
- 2728 Kinslow Ridge SE
- 2632 Downing Park Dr SE
- 2720 Kinslow Ridge SE