2645 Greenside Dr Unit 112 Beavercreek, OH 45431
Estimated Value: $274,000 - $339,000
2
Beds
3
Baths
2,597
Sq Ft
$117/Sq Ft
Est. Value
About This Home
This home is located at 2645 Greenside Dr Unit 112, Beavercreek, OH 45431 and is currently estimated at $304,600, approximately $117 per square foot. 2645 Greenside Dr Unit 112 is a home located in Greene County with nearby schools including Main Elementary School, Jacob Coy Middle School, and Beavercreek High School.
Ownership History
Date
Name
Owned For
Owner Type
Purchase Details
Closed on
Dec 22, 2009
Sold by
Reed Samue A and Reed Cheryl A
Bought by
Harris John A and Nigh Christopher L
Current Estimated Value
Home Financials for this Owner
Home Financials are based on the most recent Mortgage that was taken out on this home.
Original Mortgage
$186,200
Outstanding Balance
$120,700
Interest Rate
4.78%
Mortgage Type
New Conventional
Estimated Equity
$183,900
Purchase Details
Closed on
Dec 18, 2003
Sold by
Guyan Debra E and Guyan Richard E
Bought by
Reed Samuel A
Home Financials for this Owner
Home Financials are based on the most recent Mortgage that was taken out on this home.
Original Mortgage
$211,650
Interest Rate
5.94%
Mortgage Type
VA
Purchase Details
Closed on
Dec 30, 1998
Sold by
The Ryland Group Inc
Bought by
Guyan Richard E and Guyan Debra E
Home Financials for this Owner
Home Financials are based on the most recent Mortgage that was taken out on this home.
Original Mortgage
$190,300
Interest Rate
6.83%
Create a Home Valuation Report for This Property
The Home Valuation Report is an in-depth analysis detailing your home's value as well as a comparison with similar homes in the area
Home Values in the Area
Average Home Value in this Area
Purchase History
| Date | Buyer | Sale Price | Title Company |
|---|---|---|---|
| Harris John A | $196,000 | Attorney | |
| Reed Samuel A | $205,500 | -- | |
| Guyan Richard E | $211,500 | -- |
Source: Public Records
Mortgage History
| Date | Status | Borrower | Loan Amount |
|---|---|---|---|
| Open | Harris John A | $186,200 | |
| Closed | Reed Samuel A | $211,650 | |
| Previous Owner | Guyan Richard E | $190,300 |
Source: Public Records
Tax History Compared to Growth
Tax History
| Year | Tax Paid | Tax Assessment Tax Assessment Total Assessment is a certain percentage of the fair market value that is determined by local assessors to be the total taxable value of land and additions on the property. | Land | Improvement |
|---|---|---|---|---|
| 2024 | $6,222 | $95,310 | $21,000 | $74,310 |
| 2023 | $6,222 | $95,310 | $21,000 | $74,310 |
| 2022 | $6,242 | $84,410 | $21,000 | $63,410 |
| 2021 | $6,116 | $84,410 | $21,000 | $63,410 |
| 2020 | $6,162 | $84,410 | $21,000 | $63,410 |
| 2019 | $5,404 | $67,570 | $14,000 | $53,570 |
| 2018 | $4,769 | $67,570 | $14,000 | $53,570 |
| 2017 | $4,834 | $67,570 | $14,000 | $53,570 |
| 2016 | $4,834 | $66,350 | $14,000 | $52,350 |
| 2015 | $4,805 | $66,350 | $14,000 | $52,350 |
| 2014 | $4,733 | $66,350 | $14,000 | $52,350 |
Source: Public Records
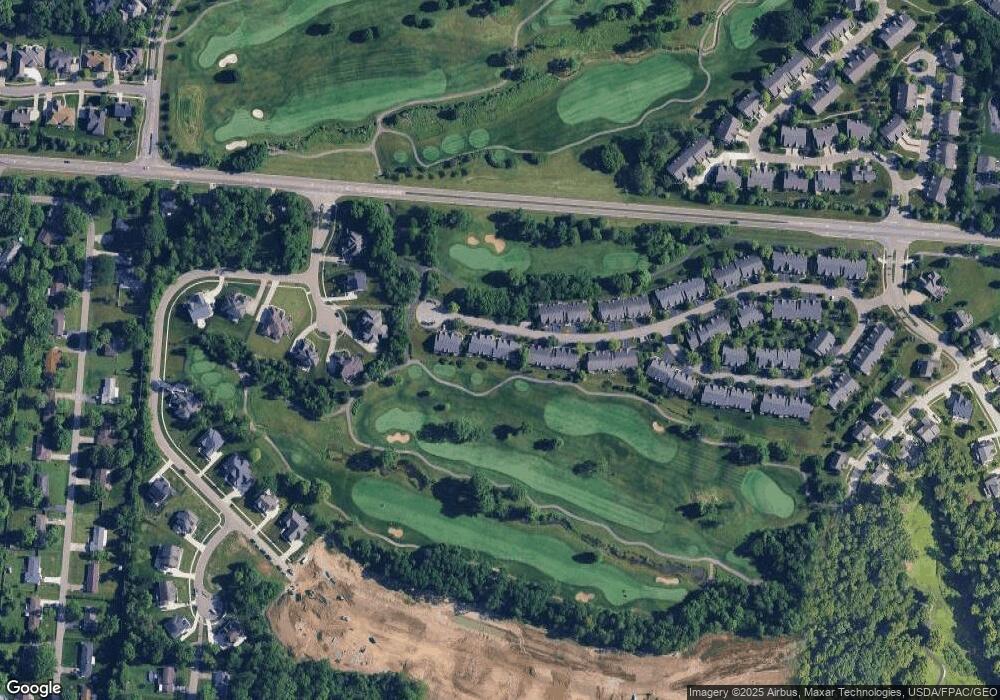
Map
Nearby Homes
- 2715 Golden Leaf Dr Unit 19-204
- 2727 Golden Leaf Dr Unit 18-300
- 2735 Golden Leaf Dr Unit 18-202
- 2741 Golden Leaf Dr Unit 18-203
- Beckett Plan at Bent Creek Woods - Masterpiece Collection
- Margot Plan at Bent Creek Woods - Masterpiece Collection
- Winslow Plan at Bent Creek Woods - Masterpiece Collection
- Rhodes Plan at Bent Creek Woods - Masterpiece Collection
- Leland Plan at Bent Creek Woods - Masterpiece Collection
- Stanton Plan at Bent Creek Woods - Masterpiece Collection
- Huxley Plan at Bent Creek Woods - Masterpiece Collection
- Paxton Plan at Bent Creek Woods - Masterpiece Collection
- Pearson Plan at Bent Creek Woods - Masterpiece Collection
- Clay Plan at Bent Creek Woods - Masterpiece Collection
- 2707 Golden Leaf Dr Unit 19-305
- 2749 Golden Leaf Dr Unit 18-305
- 2649 Golden Leaf Dr Unit 16-300
- 2669 Golden Leaf Dr Unit 16-305
- 2504 Bent Grass Dr
- 2639 Golden Leaf Dr
- 2639 Greenside Dr Unit 111
- 2651 Greenside Dr
- 2657 Greenside Dr Unit 114
- 2633 Greenside Dr Unit 104
- 2627 Greenside Dr Unit 103
- 2663 Greenside Dr Unit 121
- 2626 Greenside Dr
- 2626 Greenside Dr Unit 131
- 2669 Greenside Dr Unit 122
- 2621 Greenside Dr
- 2621 Greenside Dr Unit 102
- 2622 Greenside Dr
- 2622 Greenside Dr Unit 132
- 2615 Greenside Dr Unit 101
- 2614 Greenside Dr Unit 133
- 2612 Greenside Dr
- 2612 Greenside Dr Unit 134
- 2609 Greenside Dr Unit 94
- 2603 Greenside Dr
- 2603 Greenside Dr Unit 93