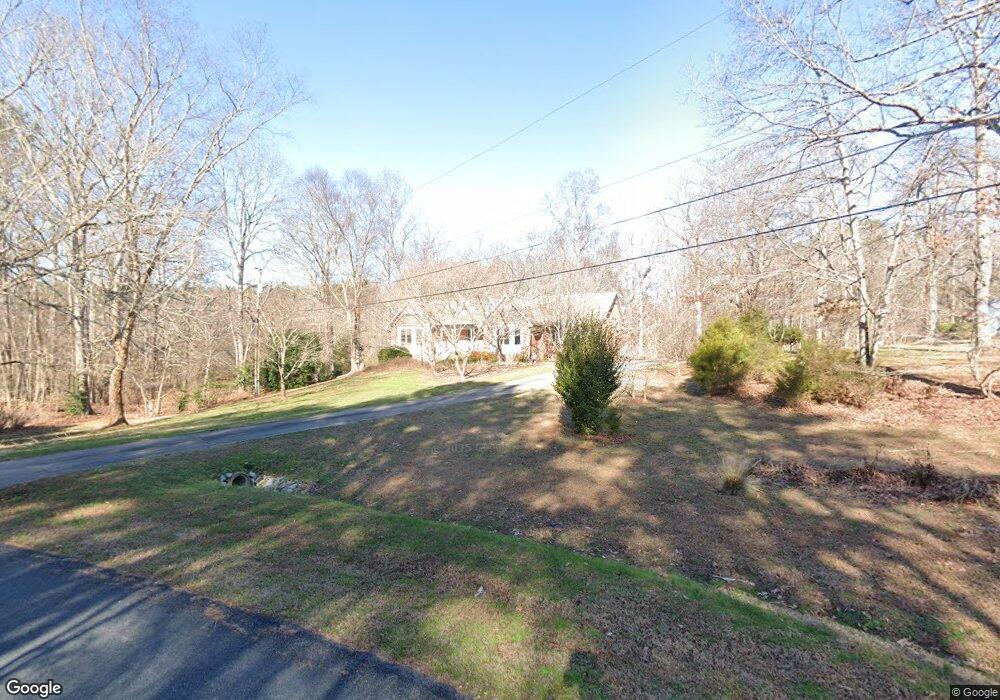
2645 Tudor Ct Concord, NC 28025
Estimated Value: $509,000 - $727,000
3
Beds
2
Baths
2,456
Sq Ft
$234/Sq Ft
Est. Value
About This Home
This home is located at 2645 Tudor Ct, Concord, NC 28025 and is currently estimated at $575,176, approximately $234 per square foot. 2645 Tudor Ct is a home located in Cabarrus County with nearby schools including W.M. Irvin Elementary School, Mount Pleasant Middle School, and Mount Pleasant High School.
Ownership History
Date
Name
Owned For
Owner Type
Purchase Details
Closed on
Mar 20, 2013
Sold by
Kinder Hof Llc
Bought by
Smith Thomas A and Smith Laura Carden
Current Estimated Value
Purchase Details
Closed on
Jan 11, 2006
Sold by
Holmes Otis Ray and Holmes Wanda W
Bought by
Thomas Linda
Home Financials for this Owner
Home Financials are based on the most recent Mortgage that was taken out on this home.
Original Mortgage
$272,000
Interest Rate
5.87%
Mortgage Type
Fannie Mae Freddie Mac
Purchase Details
Closed on
Aug 31, 2005
Sold by
Rose Lane Management Inc
Bought by
Scout Holdings Llc
Home Financials for this Owner
Home Financials are based on the most recent Mortgage that was taken out on this home.
Original Mortgage
$75,000
Interest Rate
5.71%
Mortgage Type
Purchase Money Mortgage
Purchase Details
Closed on
Jun 1, 1989
Create a Home Valuation Report for This Property
The Home Valuation Report is an in-depth analysis detailing your home's value as well as a comparison with similar homes in the area
Home Values in the Area
Average Home Value in this Area
Purchase History
| Date | Buyer | Sale Price | Title Company |
|---|---|---|---|
| Smith Thomas A | -- | None Available | |
| Thomas Linda | $340,000 | None Available | |
| Scout Holdings Llc | $75,000 | -- | |
| -- | $16,000 | -- |
Source: Public Records
Mortgage History
| Date | Status | Borrower | Loan Amount |
|---|---|---|---|
| Previous Owner | Thomas Linda | $272,000 | |
| Previous Owner | Scout Holdings Llc | $75,000 |
Source: Public Records
Tax History
| Year | Tax Paid | Tax Assessment Tax Assessment Total Assessment is a certain percentage of the fair market value that is determined by local assessors to be the total taxable value of land and additions on the property. | Land | Improvement |
|---|---|---|---|---|
| 2025 | $3,138 | $478,360 | $170,000 | $308,360 |
| 2024 | $3,138 | $478,360 | $170,000 | $308,360 |
| 2023 | $2,975 | $362,860 | $112,200 | $250,660 |
| 2022 | $2,975 | $362,860 | $112,200 | $250,660 |
| 2021 | $2,975 | $362,860 | $112,200 | $250,660 |
| 2020 | $2,903 | $362,860 | $112,200 | $250,660 |
| 2019 | $2,396 | $299,530 | $59,500 | $240,030 |
| 2018 | $2,336 | $299,530 | $59,500 | $240,030 |
| 2017 | $2,276 | $299,530 | $59,500 | $240,030 |
| 2016 | $2,276 | $287,490 | $59,500 | $227,990 |
| 2015 | $2,185 | $287,490 | $59,500 | $227,990 |
| 2014 | $2,185 | $287,490 | $59,500 | $227,990 |
Source: Public Records
Map
Nearby Homes
- 2568 Chelsea Dr
- 1901 Thompson Dr
- 1144 Tangle Ridge Dr SE
- 1614 Colfax Dr SE
- 1160 Crestmont Dr SE Unit A3
- 1800 Lake Lynn Rd
- 1193 Tangle Ridge Dr SE
- 348 Pleasant View Ln SE
- 2511 Willow Pond Ln SE
- 1982 Old Farm Rd SE
- 496 Majestic Ct SE
- 552 Tripolis St SE
- 335 Eastcliff Dr SE
- 271 Ikerd Dr SE
- 267 Ikerd Dr SE
- 00 Heglar Rd Unit 1
- 00 Heglar Rd
- 2365 Baxter Place SE
- 467 Countrywood Place SE Unit 25
- 467 Countrywood Place SE
- 2581 Essex Dr
- 2578 Essex Dr Unit 14
- 2577 Essex Dr
- 2664 Tudor Ct
- 2562 Essex Dr
- 2566 Essex Dr
- 2567 Chelsea Dr
- 2555 Chelsea Dr
- 2674 Tudor Ct
- 811 Crestmont Dr SE
- 1211 Thompson Dr
- 2465 Chelsea Dr
- 1925 Thompson Dr
- 2675 Tudor Ct
- 1922 Thompson Dr
- 1907 Thompson Dr
- 1833 Thompson Dr
- 507 Kacys Way Place SE
- 511 Kacys Way Place SE
- 504 Kacys Way Place SE
Your Personal Tour Guide
Ask me questions while you tour the home.