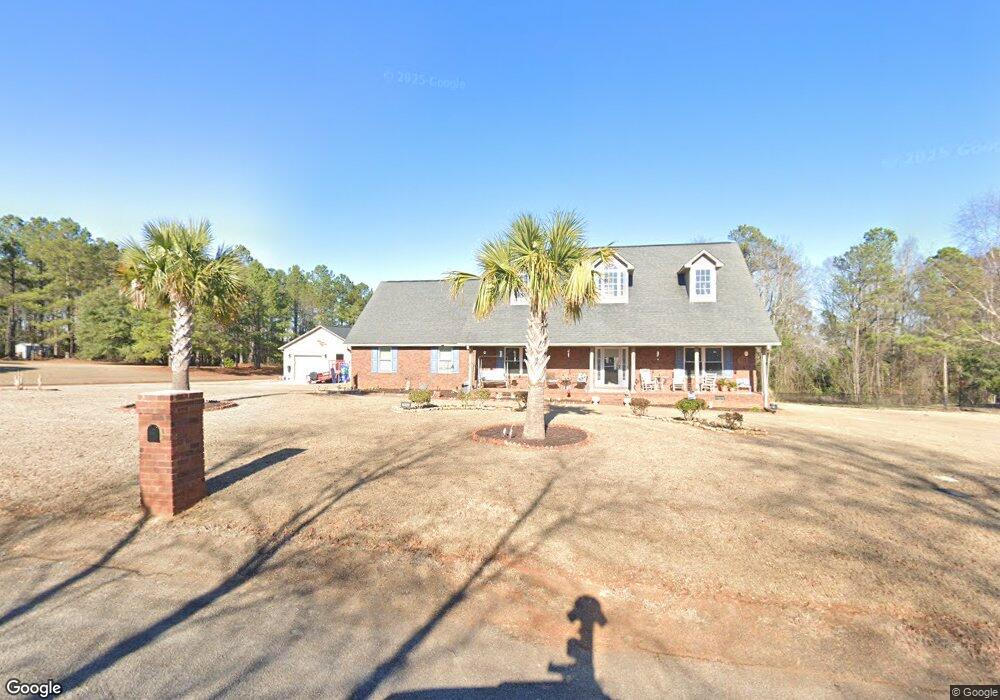
2645 Turning Leaf Ln Dalzell, SC 29040
Estimated Value: $272,000 - $358,096
4
Beds
2
Baths
2,664
Sq Ft
$121/Sq Ft
Est. Value
About This Home
This home is located at 2645 Turning Leaf Ln, Dalzell, SC 29040 and is currently estimated at $322,774, approximately $121 per square foot. 2645 Turning Leaf Ln is a home located in Sumter County with nearby schools including Oakland Primary School, High Hills Elementary School, and Shaw Heights Elementary School.
Ownership History
Date
Name
Owned For
Owner Type
Purchase Details
Closed on
Oct 30, 2020
Sold by
Vannote Frank and Vannote Van Note
Bought by
Burgess Keenan G and Burgess Sandra C
Current Estimated Value
Home Financials for this Owner
Home Financials are based on the most recent Mortgage that was taken out on this home.
Original Mortgage
$180,000
Outstanding Balance
$159,074
Interest Rate
2.8%
Mortgage Type
New Conventional
Estimated Equity
$163,700
Purchase Details
Closed on
Sep 2, 2009
Sold by
Davis James O
Bought by
Vannote Elaine and Van Note Frank
Home Financials for this Owner
Home Financials are based on the most recent Mortgage that was taken out on this home.
Original Mortgage
$120,000
Interest Rate
5.14%
Mortgage Type
New Conventional
Purchase Details
Closed on
Oct 16, 2006
Sold by
Davis & Ross Construction Co Inc
Bought by
Davis James O
Create a Home Valuation Report for This Property
The Home Valuation Report is an in-depth analysis detailing your home's value as well as a comparison with similar homes in the area
Purchase History
| Date | Buyer | Sale Price | Title Company |
|---|---|---|---|
| Burgess Keenan G | $280,000 | None Available | |
| Burgess Keenan G | $280,000 | Curtis & Croft Llc | |
| Vannote Elaine | $196,000 | -- | |
| Davis James O | $125,000 | None Available | |
| Davis & Ross Construction Co Inc | $14,000 | None Available |
Source: Public Records
Mortgage History
| Date | Status | Borrower | Loan Amount |
|---|---|---|---|
| Open | Burgess Keenan G | $180,000 | |
| Closed | Burgess Keenan G | $180,000 | |
| Previous Owner | Vannote Elaine | $120,000 |
Source: Public Records
Tax History
| Year | Tax Paid | Tax Assessment Tax Assessment Total Assessment is a certain percentage of the fair market value that is determined by local assessors to be the total taxable value of land and additions on the property. | Land | Improvement |
|---|---|---|---|---|
| 2025 | $1,938 | $12,580 | $960 | $11,620 |
| 2024 | $1,938 | $12,580 | $960 | $11,620 |
| 2023 | $1,938 | $12,510 | $960 | $11,550 |
| 2022 | $1,937 | $12,510 | $960 | $11,550 |
| 2021 | $1,481 | $9,430 | $960 | $8,470 |
| 2020 | $1,065 | $8,330 | $960 | $7,370 |
| 2019 | $1,040 | $8,330 | $960 | $7,370 |
| 2018 | $975 | $8,330 | $960 | $7,370 |
| 2017 | $1,244 | $8,330 | $960 | $7,370 |
| 2016 | $1,326 | $8,330 | $960 | $7,370 |
| 2015 | $1,289 | $8,030 | $800 | $7,230 |
| 2014 | $1,289 | $8,030 | $800 | $7,230 |
| 2013 | -- | $8,030 | $800 | $7,230 |
Source: Public Records
Map
Nearby Homes
- 4570 Seymour Rd
- 2890 Bend K Dr
- 4855 Solstice Dr
- 4550 Seymour Dr Lot 7
- 2525 Autumn Terrace
- 5065 Seymour Rd
- 0 Equinox Ave Unit 615972
- 2490 Navigator Cir
- 2690 Navigator Cir
- 2450 Navigator Cir
- 4605 Excursion Dr
- 2755 Navigator Cir
- 3070 Peach Orchard Rd
- 00 Frierson Rd
- 2595 Peach Orchard Rd
- 3140 Peach Orchard Rd
- 5565 Schellin Dr
- 5173 Benenhaley Rd
- 2460 Woodhaven Rd
- 4 Valleybrook Ct
- 2645 Turningleaf Ln
- 2635 Turningleaf Ln
- 2655 Turningleaf Ln
- 2655 Turning Leaf Ln
- 2625 Turning Leaf Ln
- 2640 Turning Leaf Ln
- 2640 Turningleaf Ln
- 2630 Turningleaf Ln
- 2630 Turning Leaf Ln
- 2650 Turning Leaf Ln
- 2665 Turning Leaf Ln
- 2620 Turningleaf Ln
- 4805 Seymour Rd
- 2620 Turning Leaf Ln
- 2615 Turning Leaf Ln
- 2615 Turningleaf Ln
- 2660 Turning Leaf Ln
- 2675 Turning Leaf Ln
- 2610 Turning Leaf Ln
- 2610 Turningleaf Ln