Estimated Value: $418,000 - $449,000
4
Beds
1
Bath
1,719
Sq Ft
$250/Sq Ft
Est. Value
About This Home
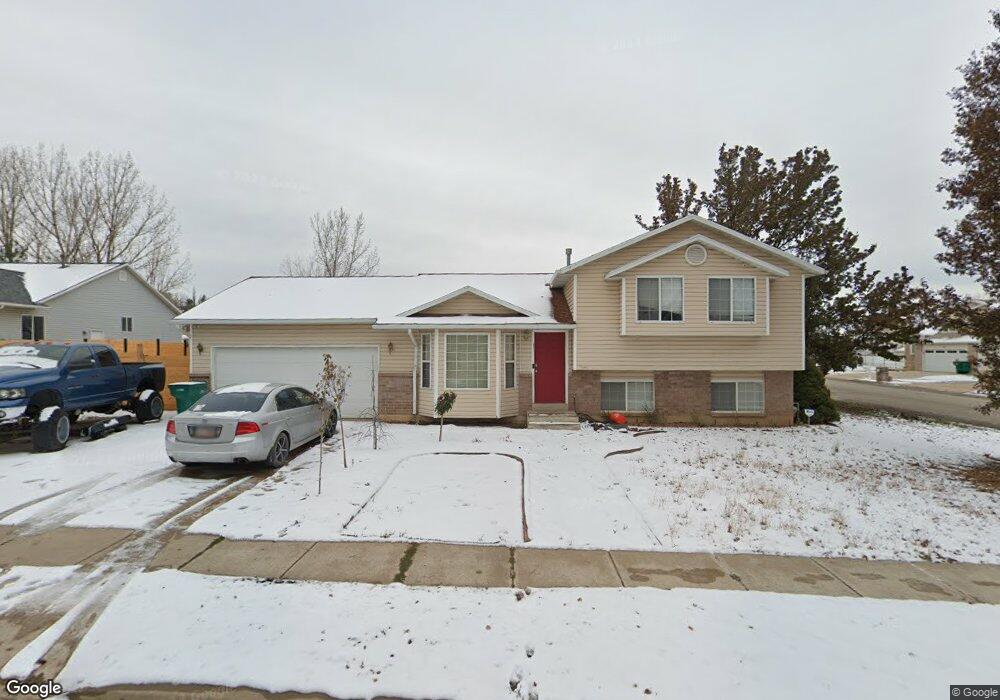
This home is located at 2645 W 4225 S, Roy, UT 84067 and is currently estimated at $429,263, approximately $249 per square foot. 2645 W 4225 S is a home located in Weber County with nearby schools including Valley View School, Sand Ridge Junior High School, and Roy High School.
Ownership History
Date
Name
Owned For
Owner Type
Purchase Details
Closed on
Apr 8, 2015
Sold by
Anderson Trent D and Anderson Camille F
Bought by
Auvinen Jeremiah
Current Estimated Value
Home Financials for this Owner
Home Financials are based on the most recent Mortgage that was taken out on this home.
Original Mortgage
$163,876
Outstanding Balance
$126,246
Interest Rate
3.76%
Mortgage Type
FHA
Estimated Equity
$303,017
Purchase Details
Closed on
Mar 24, 2005
Sold by
Barnes Travis P and Barnes Steffanie
Bought by
Anderson Trent D
Purchase Details
Closed on
Oct 6, 1998
Sold by
Allred Jeffrey D and Hart Laura L
Bought by
Barnes Travis P
Home Financials for this Owner
Home Financials are based on the most recent Mortgage that was taken out on this home.
Original Mortgage
$116,513
Interest Rate
6.88%
Mortgage Type
FHA
Create a Home Valuation Report for This Property
The Home Valuation Report is an in-depth analysis detailing your home's value as well as a comparison with similar homes in the area
Home Values in the Area
Average Home Value in this Area
Purchase History
| Date | Buyer | Sale Price | Title Company |
|---|---|---|---|
| Auvinen Jeremiah | -- | Lincoln Title Ins Agency | |
| Anderson Trent D | -- | First American Title | |
| Barnes Travis P | -- | Associated Title Company |
Source: Public Records
Mortgage History
| Date | Status | Borrower | Loan Amount |
|---|---|---|---|
| Open | Auvinen Jeremiah | $163,876 | |
| Previous Owner | Barnes Travis P | $116,513 |
Source: Public Records
Tax History Compared to Growth
Tax History
| Year | Tax Paid | Tax Assessment Tax Assessment Total Assessment is a certain percentage of the fair market value that is determined by local assessors to be the total taxable value of land and additions on the property. | Land | Improvement |
|---|---|---|---|---|
| 2025 | $2,489 | $392,337 | $135,012 | $257,325 |
| 2024 | $2,386 | $207,899 | $74,256 | $133,643 |
| 2023 | $2,234 | $194,150 | $71,317 | $122,833 |
| 2022 | $2,512 | $227,700 | $60,501 | $167,199 |
| 2021 | $1,986 | $294,000 | $75,002 | $218,998 |
| 2020 | $1,914 | $261,000 | $75,002 | $185,998 |
| 2019 | $1,925 | $248,000 | $49,906 | $198,094 |
| 2018 | $1,766 | $213,000 | $44,976 | $168,024 |
| 2017 | $1,627 | $183,000 | $43,029 | $139,971 |
| 2016 | $1,567 | $94,696 | $24,773 | $69,923 |
| 2015 | $1,372 | $83,992 | $24,773 | $59,219 |
| 2014 | $1,265 | $75,645 | $21,944 | $53,701 |
Source: Public Records
Map
Nearby Homes
- 4118 Westlake Dr
- 2802 W 4375 S
- 2778 W 4175 S Unit 235
- 2777 W 4175 S Unit 229
- 2835 W 4200 S
- 2816 W 4400 S
- 4022 S 2725 W
- 2642 W 4400 S
- 4164 S 2400 W
- 4553 Trailside Dr
- 2979 W 4275 S
- 2917 W 3970 S Unit 53
- 3860 S Midland Dr Unit B97
- 3860 S Midland Dr Unit B59
- 3860 S Midland Dr Unit B 51
- 4110 S 2275 W
- 1952 W 5450 S
- 2263 W 4400 S
- 3891 S 2940 W
- 4670 S 2525 W
- 4244 Westlake Dr
- 2635 W 4225 S
- 2648 W 4225 S
- 4262 Westlake Dr
- 2623 W 4225 S
- 4227 Westlake Dr
- 4249 Westlake Dr
- 4221 Westlake Dr
- 2638 W 4225 S
- 4280 Westlake Dr
- 4271 Westlake Dr
- 4214 Westlake Dr
- 2626 W 4225 S
- 2615 W 4225 S
- 4217 Westlake Dr
- 4206 Westlake Dr
- 4211 Westlake Dr
- 2710 W 4275 S
- 4224 S 2700 W
- 4224 S 2700 W Unit 227