Estimated Value: $392,000 - $452,000
6
Beds
2
Baths
1,850
Sq Ft
$228/Sq Ft
Est. Value
About This Home
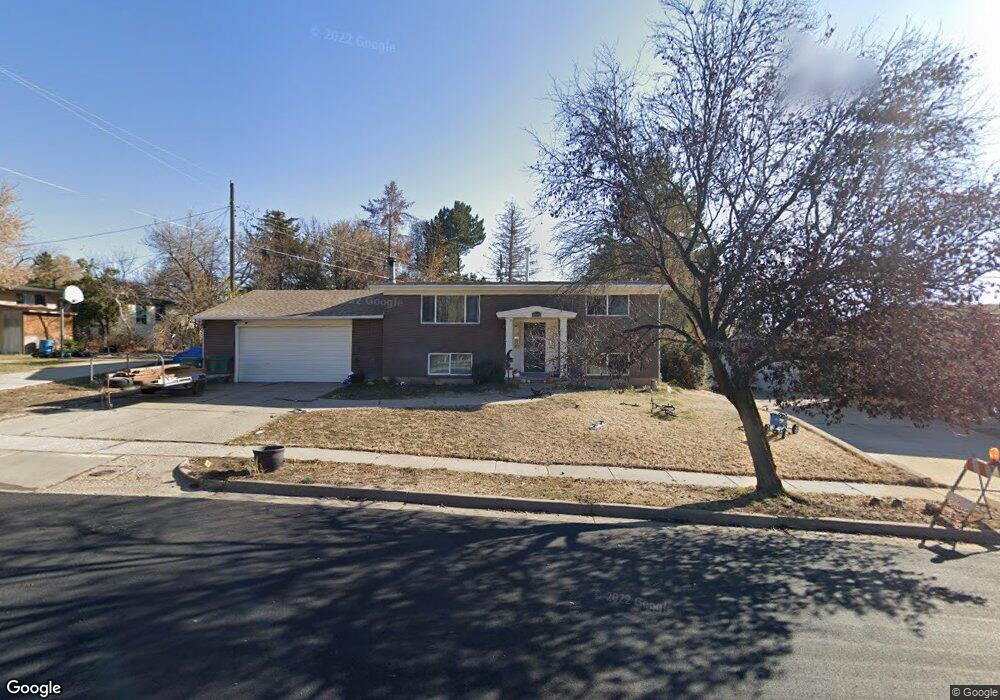
This home is located at 2645 W 5100 S, Roy, UT 84067 and is currently estimated at $422,434, approximately $228 per square foot. 2645 W 5100 S is a home located in Weber County with nearby schools including Lakeview Elementary School, Roy Junior High School, and Roy High School.
Ownership History
Date
Name
Owned For
Owner Type
Purchase Details
Closed on
Mar 20, 2023
Sold by
Castro Juan
Bought by
Robles Fernando and Robles Marissa
Current Estimated Value
Home Financials for this Owner
Home Financials are based on the most recent Mortgage that was taken out on this home.
Original Mortgage
$378,026
Outstanding Balance
$366,073
Interest Rate
6.09%
Mortgage Type
FHA
Estimated Equity
$56,361
Purchase Details
Closed on
Jul 19, 2019
Sold by
Abc Holdings Llc
Bought by
Castro Juan and Castro Sarika
Home Financials for this Owner
Home Financials are based on the most recent Mortgage that was taken out on this home.
Original Mortgage
$229,600
Interest Rate
3.82%
Mortgage Type
New Conventional
Purchase Details
Closed on
Apr 29, 2013
Sold by
Buck Larry B and Buck Bertha Ann
Bought by
Abc Holdings Llc
Create a Home Valuation Report for This Property
The Home Valuation Report is an in-depth analysis detailing your home's value as well as a comparison with similar homes in the area
Home Values in the Area
Average Home Value in this Area
Purchase History
| Date | Buyer | Sale Price | Title Company |
|---|---|---|---|
| Robles Fernando | -- | Old Republic Title | |
| Castro Juan | -- | Richland Title Ins Agcy I | |
| Abc Holdings Llc | -- | Founders Title Company Syrac |
Source: Public Records
Mortgage History
| Date | Status | Borrower | Loan Amount |
|---|---|---|---|
| Open | Robles Fernando | $378,026 | |
| Previous Owner | Castro Juan | $229,600 |
Source: Public Records
Tax History Compared to Growth
Tax History
| Year | Tax Paid | Tax Assessment Tax Assessment Total Assessment is a certain percentage of the fair market value that is determined by local assessors to be the total taxable value of land and additions on the property. | Land | Improvement |
|---|---|---|---|---|
| 2025 | $2,596 | $409,916 | $126,265 | $283,651 |
| 2024 | $2,534 | $221,649 | $69,446 | $152,203 |
| 2023 | $2,257 | $195,800 | $65,733 | $130,067 |
| 2022 | $2,431 | $398,000 | $103,136 | $294,864 |
| 2021 | $1,859 | $272,000 | $72,748 | $199,252 |
| 2020 | $1,709 | $229,000 | $72,748 | $156,252 |
| 2019 | $1,706 | $216,000 | $44,125 | $171,875 |
| 2018 | $1,571 | $186,000 | $39,977 | $146,023 |
| 2017 | $1,512 | $167,869 | $39,977 | $127,892 |
| 2016 | $1,413 | $83,891 | $19,606 | $64,285 |
| 2015 | $1,239 | $74,398 | $16,808 | $57,590 |
| 2014 | $1,202 | $71,067 | $16,808 | $54,259 |
Source: Public Records
Map
Nearby Homes