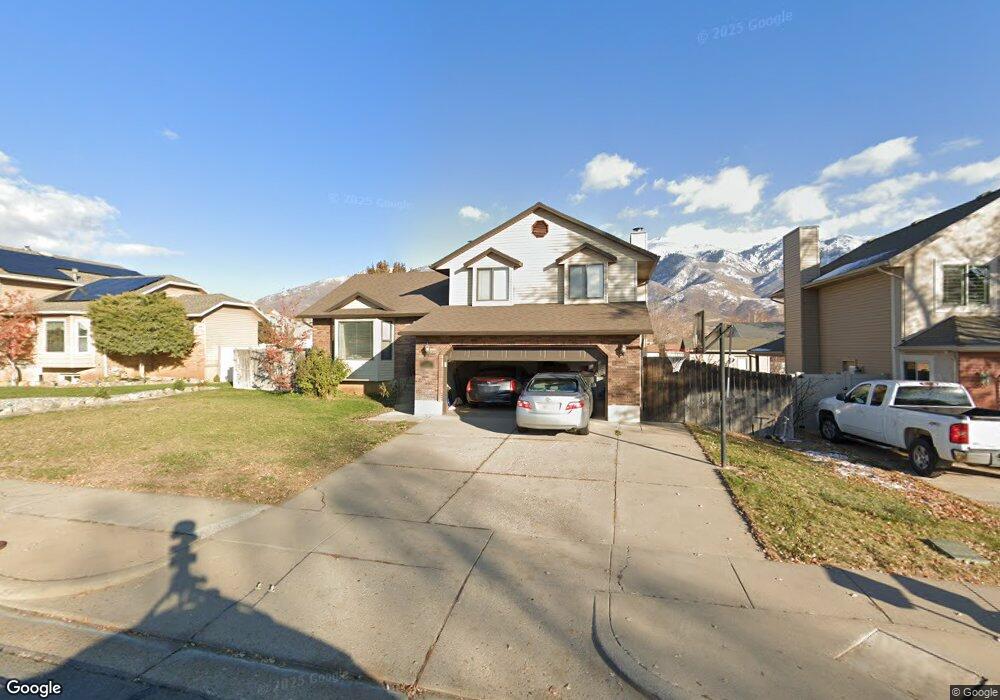
2646 N 1650 E Layton, UT 84040
Estimated Value: $499,259 - $531,000
5
Beds
2
Baths
2,133
Sq Ft
$240/Sq Ft
Est. Value
About This Home
This home is located at 2646 N 1650 E, Layton, UT 84040 and is currently estimated at $511,565, approximately $239 per square foot. 2646 N 1650 E is a home located in Davis County with nearby schools including Mountain View Elementary School, North Layton Junior High School, and Northridge High School.
Ownership History
Date
Name
Owned For
Owner Type
Purchase Details
Closed on
Aug 26, 2022
Sold by
Max Perez
Bought by
Davis Terry C and Davis Lindsi Sue
Current Estimated Value
Home Financials for this Owner
Home Financials are based on the most recent Mortgage that was taken out on this home.
Original Mortgage
$480,000
Outstanding Balance
$456,940
Interest Rate
4.99%
Mortgage Type
VA
Estimated Equity
$54,625
Purchase Details
Closed on
Nov 27, 2018
Sold by
Pulido Daniel and Pulido Jerilyn W
Bought by
Perez Max and Malcolm Nichole
Home Financials for this Owner
Home Financials are based on the most recent Mortgage that was taken out on this home.
Original Mortgage
$284,798
Interest Rate
5.25%
Mortgage Type
FHA
Create a Home Valuation Report for This Property
The Home Valuation Report is an in-depth analysis detailing your home's value as well as a comparison with similar homes in the area
Home Values in the Area
Average Home Value in this Area
Purchase History
| Date | Buyer | Sale Price | Title Company |
|---|---|---|---|
| Davis Terry C | -- | -- | |
| Perez Max | -- | First American Title |
Source: Public Records
Mortgage History
| Date | Status | Borrower | Loan Amount |
|---|---|---|---|
| Open | Davis Terry C | $480,000 | |
| Previous Owner | Perez Max | $284,798 |
Source: Public Records
Tax History
| Year | Tax Paid | Tax Assessment Tax Assessment Total Assessment is a certain percentage of the fair market value that is determined by local assessors to be the total taxable value of land and additions on the property. | Land | Improvement |
|---|---|---|---|---|
| 2025 | $234 | $257,400 | $109,164 | $148,236 |
| 2024 | $2,561 | $249,150 | $135,400 | $113,750 |
| 2023 | $2,505 | $434,000 | $188,369 | $245,631 |
| 2022 | $2,599 | $246,401 | $100,524 | $145,877 |
| 2021 | $2,420 | $342,000 | $152,165 | $189,835 |
| 2020 | $2,196 | $297,000 | $119,993 | $177,007 |
| 2019 | $2,102 | $280,000 | $107,878 | $172,122 |
| 2018 | $117 | $239,000 | $64,509 | $174,491 |
| 2016 | $77 | $112,145 | $32,937 | $79,208 |
| 2015 | $1,520 | $101,475 | $32,937 | $68,538 |
| 2014 | $1,466 | $100,742 | $32,937 | $67,805 |
| 2013 | -- | $101,493 | $22,748 | $78,745 |
Source: Public Records
Map
Nearby Homes
- 3142 E Thorley Dr
- 3138 E Thorley Dr
- 2826 N 1600 E
- 1731 E 2825 N
- 1785 E 2825 N
- 1447 E 2700 N
- 1911 Deere Valley Dr
- 1935 Deere Valley Dr
- 1444 E 2400 N
- 1821 E Whitetail Way
- 2273 N 1975 E
- 2340 N 2050 E
- 2189 N 1950 E
- 1827 E Whitetail Dr
- 2096 N 1450 E
- 3176 N 1450 E
- 2597 N 2300 E
- 1241 E 3075 N
- 2315 N 1075 E
- 1266 E 3125 N
Your Personal Tour Guide
Ask me questions while you tour the home.