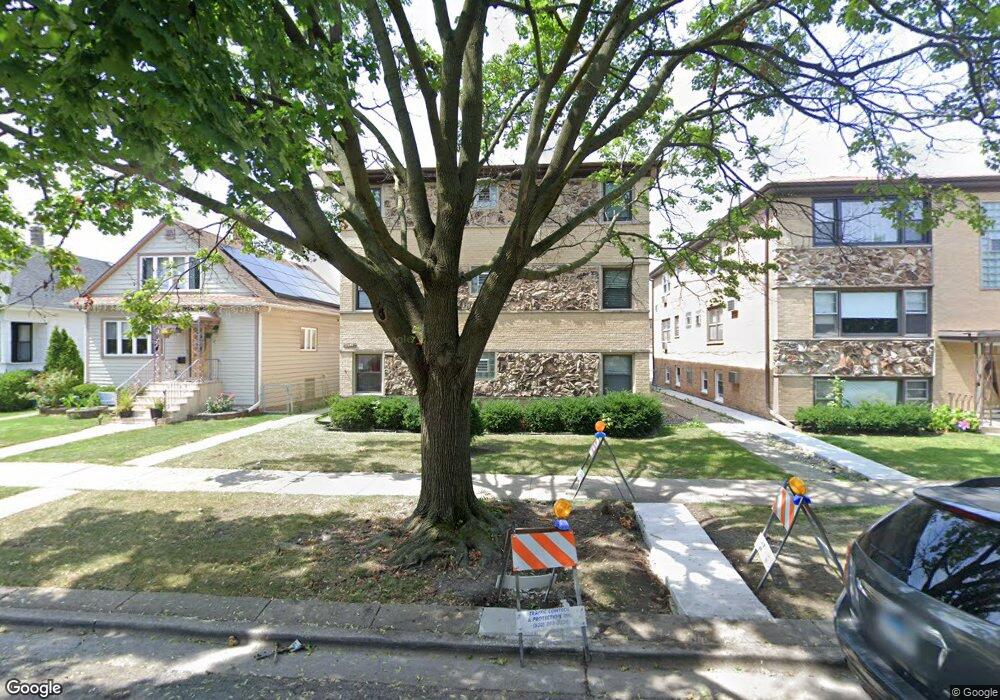
2646 N 72nd Ct Unit 5 Elmwood Park, IL 60707
Estimated Value: $176,000 - $244,000
2
Beds
1
Bath
1,287
Sq Ft
$160/Sq Ft
Est. Value
About This Home
This home is located at 2646 N 72nd Ct Unit 5, Elmwood Park, IL 60707 and is currently estimated at $205,726, approximately $159 per square foot. 2646 N 72nd Ct Unit 5 is a home located in Cook County with nearby schools including John Mills Elementary School, Elm Middle School, and Elmwood Park High School.
Ownership History
Date
Name
Owned For
Owner Type
Purchase Details
Closed on
Mar 9, 2020
Sold by
Diaz Jose and Diaz Patricia
Bought by
Lako Entela
Current Estimated Value
Purchase Details
Closed on
Dec 4, 2018
Sold by
Davis Lana and Mikolas Lana
Bought by
Diaz Jose and Diaz Patricia
Home Financials for this Owner
Home Financials are based on the most recent Mortgage that was taken out on this home.
Original Mortgage
$90,000
Interest Rate
5.75%
Mortgage Type
New Conventional
Purchase Details
Closed on
Jul 17, 2013
Sold by
Pantanella Melodina L
Bought by
Mikolas Lana
Home Financials for this Owner
Home Financials are based on the most recent Mortgage that was taken out on this home.
Original Mortgage
$85,500
Interest Rate
4.5%
Mortgage Type
New Conventional
Purchase Details
Closed on
Mar 22, 1995
Sold by
Cancel August V and Cancel Margarita G
Bought by
Pantanella Dario and Pantanella Melodina L
Create a Home Valuation Report for This Property
The Home Valuation Report is an in-depth analysis detailing your home's value as well as a comparison with similar homes in the area
Home Values in the Area
Average Home Value in this Area
Purchase History
| Date | Buyer | Sale Price | Title Company |
|---|---|---|---|
| Lako Entela | $145,000 | Attorney S Ttl Guaranty Fund | |
| Diaz Jose | $120,000 | First American Title Insuran | |
| Mikolas Lana | $90,000 | Chicago Title Insurance Co | |
| Pantanella Dario | $90,000 | -- |
Source: Public Records
Mortgage History
| Date | Status | Borrower | Loan Amount |
|---|---|---|---|
| Previous Owner | Diaz Jose | $90,000 | |
| Previous Owner | Mikolas Lana | $85,500 |
Source: Public Records
Tax History Compared to Growth
Tax History
| Year | Tax Paid | Tax Assessment Tax Assessment Total Assessment is a certain percentage of the fair market value that is determined by local assessors to be the total taxable value of land and additions on the property. | Land | Improvement |
|---|---|---|---|---|
| 2024 | $4,197 | $13,870 | $1,553 | $12,317 |
| 2023 | $4,073 | $13,870 | $1,553 | $12,317 |
| 2022 | $4,073 | $13,870 | $1,553 | $12,317 |
| 2021 | $4,268 | $11,364 | $1,035 | $10,329 |
| 2020 | $4,124 | $11,364 | $1,035 | $10,329 |
| 2019 | $3,871 | $13,275 | $1,035 | $12,240 |
| 2018 | $2,020 | $9,658 | $891 | $8,767 |
| 2017 | $1,972 | $9,658 | $891 | $8,767 |
| 2016 | $2,027 | $9,658 | $891 | $8,767 |
| 2015 | $2,556 | $8,226 | $805 | $7,421 |
| 2014 | $2,490 | $8,226 | $805 | $7,421 |
| 2013 | $1,653 | $8,226 | $805 | $7,421 |
Source: Public Records
Map
Nearby Homes
- 2716 N 73rd Ave
- 2637 N 73rd Ct
- 2724 N 73rd Ave
- 2734 N 72nd Ct
- 2546 N Harlem Ave Unit GC
- 2530 N 72nd Ct Unit 2W
- 2525 N 72nd Ct Unit 2AN
- 2513 N 72nd Ct
- 2530 N Neva Ave
- 2719 N 74th Ct
- 2659 N Mont Clare Ave
- 2730 N 74th Ct Unit GW
- 2734 N 74th Ct
- 2524 N Mont Clare Ave
- 7062 W Diversey Ave
- 2919 N Harlem Ave Unit 510
- 2915 N 74th Ave Unit 2
- 2930 N Harlem Ave Unit 5D
- 7150 W Grand Ave
- 2832 N 75th Ave
- 2646 N 72nd Ct Unit 3
- 2646 N 72nd Ct Unit 2
- 2646 N 72nd Ct Unit 4
- 2646 N 72nd Ct Unit 1
- 2648 N 72nd Ct
- 2648 N 72nd Ct Unit 2
- 2642 N 72nd Ct
- 2640 N 72nd Ct
- 2650 N 72nd Ct
- 2636 N 72nd Ct
- 2652 N 72nd Ct
- 2652 N 72nd Ct
- 2634 N 72nd Ct
- 2651 N 73rd Ave
- 2632 N 72nd Ct
- 2653 N 73rd Ave
- 2637 N 73rd Ave
- 2647 N 72nd Ct
- 2630 N 72nd Ct
- 2630 N 72nd Ct