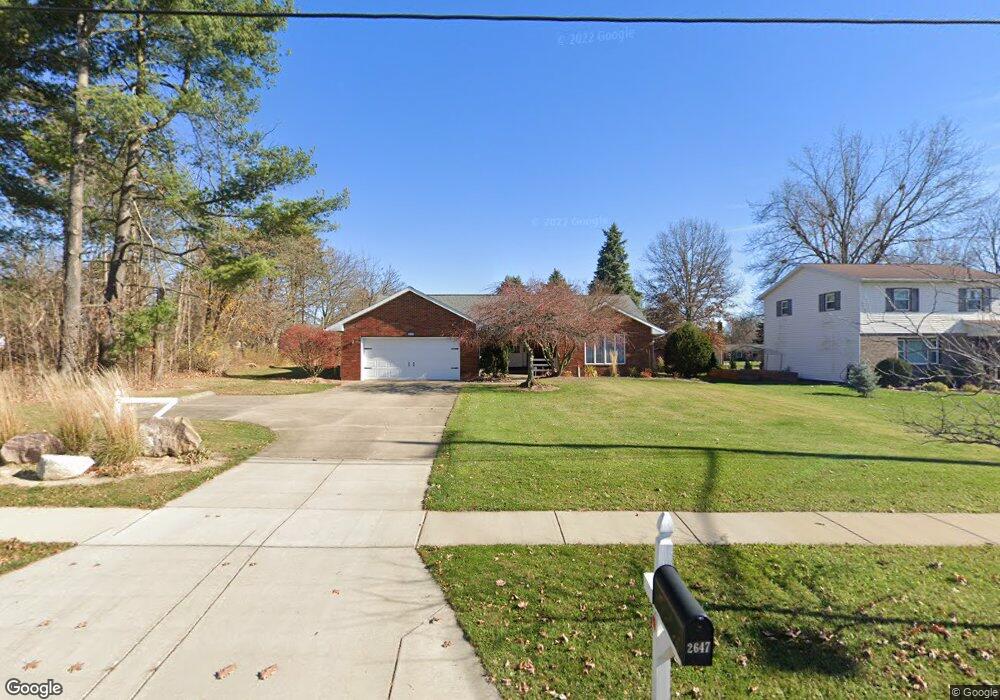
2647 Burbank Rd Wooster, OH 44691
Estimated Value: $276,000 - $316,000
3
Beds
3
Baths
1,636
Sq Ft
$178/Sq Ft
Est. Value
About This Home
This home is located at 2647 Burbank Rd, Wooster, OH 44691 and is currently estimated at $290,925, approximately $177 per square foot. 2647 Burbank Rd is a home located in Wayne County with nearby schools including Kean Elementary School, Parkview Elementary School, and Edgewood Middle School.
Ownership History
Date
Name
Owned For
Owner Type
Purchase Details
Closed on
Sep 18, 2017
Sold by
Rickert Harvey A
Bought by
Costa David G and Costa Jody E
Current Estimated Value
Home Financials for this Owner
Home Financials are based on the most recent Mortgage that was taken out on this home.
Original Mortgage
$140,822
Outstanding Balance
$117,119
Interest Rate
3.75%
Mortgage Type
FHA
Estimated Equity
$173,806
Purchase Details
Closed on
Jun 25, 2011
Sold by
Mclintock Mark C and Mcclintock Jon P
Bought by
Rickert Harvey A
Home Financials for this Owner
Home Financials are based on the most recent Mortgage that was taken out on this home.
Original Mortgage
$101,250
Interest Rate
4.67%
Mortgage Type
New Conventional
Purchase Details
Closed on
May 1, 1986
Bought by
Mcclintock Charles P and Mcclintock Lo
Create a Home Valuation Report for This Property
The Home Valuation Report is an in-depth analysis detailing your home's value as well as a comparison with similar homes in the area
Home Values in the Area
Average Home Value in this Area
Purchase History
| Date | Buyer | Sale Price | Title Company |
|---|---|---|---|
| Costa David G | $144,000 | None Available | |
| Rickert Harvey A | $135,000 | Attorney | |
| Mcclintock Charles P | $14,000 | -- |
Source: Public Records
Mortgage History
| Date | Status | Borrower | Loan Amount |
|---|---|---|---|
| Open | Costa David G | $140,822 | |
| Previous Owner | Rickert Harvey A | $101,250 |
Source: Public Records
Tax History Compared to Growth
Tax History
| Year | Tax Paid | Tax Assessment Tax Assessment Total Assessment is a certain percentage of the fair market value that is determined by local assessors to be the total taxable value of land and additions on the property. | Land | Improvement |
|---|---|---|---|---|
| 2024 | $2,929 | $74,910 | $17,960 | $56,950 |
| 2023 | $2,929 | $74,910 | $17,960 | $56,950 |
| 2022 | $2,542 | $53,120 | $12,730 | $40,390 |
| 2021 | $2,614 | $53,120 | $12,730 | $40,390 |
| 2020 | $2,491 | $53,120 | $12,730 | $40,390 |
| 2019 | $2,407 | $49,790 | $11,940 | $37,850 |
| 2018 | $2,413 | $49,790 | $11,940 | $37,850 |
| 2017 | $2,459 | $49,790 | $11,940 | $37,850 |
| 2016 | $2,834 | $47,980 | $11,940 | $36,040 |
| 2015 | $2,214 | $47,980 | $11,940 | $36,040 |
| 2014 | $2,215 | $47,980 | $11,940 | $36,040 |
| 2013 | $2,398 | $50,740 | $11,970 | $38,770 |
Source: Public Records
Map
Nearby Homes
- 437 Mather Hill Dr
- 220 Imgard St
- 471 Mather Hill Dr
- 458 Mather Hill Dr
- 220 Kinney St
- 539 Forest Creek Dr Unit 6842
- 2206 Graustark Path
- V/L 6838 Forest Creek Dr
- 594 Forest Creek Dr
- 2580 Christmas Run Blvd
- 0 Winkler Dr
- 2208 Cleveland Rd
- 536 Catalina Blvd
- 317 Ihrig Ave
- 751 Greenwood Blvd
- 2626 Monterey St
- 728 Portage Rd
- 2642 Imperial St
- 3377 Friendsville Rd
- 3393 Friendsville Rd
- 2635 Burbank Rd
- 2636 Taylor St
- 2623 Burbank Rd
- 2648 Taylor Dr
- 2636 Taylor Dr
- 2673 Burbank Rd
- 2620 Taylor Dr
- 2662 Taylor Dr
- 2601 Burbank Rd
- 2598 Taylor Dr
- 2676 Taylor Dr
- 2589 Burbank Rd
- 2635 Taylor Dr
- 2621 Taylor Dr
- 2586 Taylor St
- 2663 Taylor St
- 2586 Taylor Dr
- 2691 Burbank Rd
- 2692 Taylor Dr
- 2692 Taylor Dr