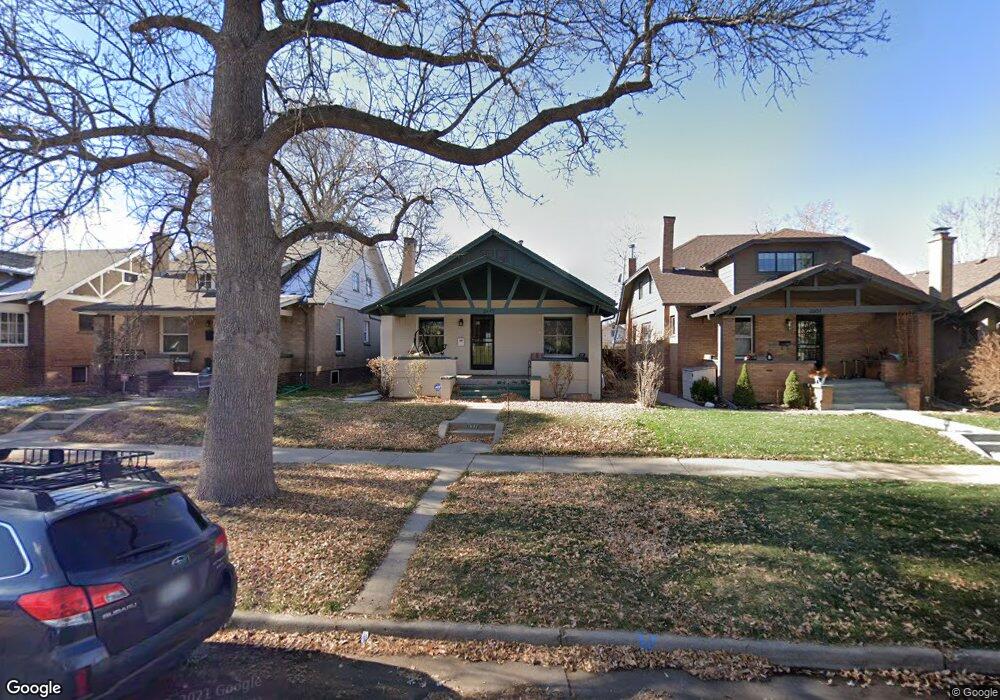
2647 Josephine St Denver, CO 80205
Skyland NeighborhoodEstimated Value: $759,000 - $792,000
4
Beds
2
Baths
2,268
Sq Ft
$342/Sq Ft
Est. Value
About This Home
This home is located at 2647 Josephine St, Denver, CO 80205 and is currently estimated at $775,839, approximately $342 per square foot. 2647 Josephine St is a home located in Denver County with nearby schools including Columbine Elementary School, Whittier ECE-8 School, and McAuliffe Manual Middle School.
Ownership History
Date
Name
Owned For
Owner Type
Purchase Details
Closed on
Jun 30, 2010
Sold by
Stobaugh Steve R and Stobaugh Angel
Bought by
Pureber Ryan T and Pureber Teresa E
Current Estimated Value
Home Financials for this Owner
Home Financials are based on the most recent Mortgage that was taken out on this home.
Original Mortgage
$261,478
Outstanding Balance
$180,394
Interest Rate
5.5%
Mortgage Type
FHA
Estimated Equity
$595,445
Purchase Details
Closed on
Mar 28, 1997
Sold by
Butler Anthony F
Bought by
Stobaugh Steve R and Stobaugh Angel
Home Financials for this Owner
Home Financials are based on the most recent Mortgage that was taken out on this home.
Original Mortgage
$97,444
Interest Rate
7.55%
Mortgage Type
FHA
Purchase Details
Closed on
Jan 31, 1994
Sold by
Simmons Phyllis O
Bought by
Butler Anthony F
Home Financials for this Owner
Home Financials are based on the most recent Mortgage that was taken out on this home.
Original Mortgage
$56,000
Interest Rate
7.12%
Mortgage Type
FHA
Create a Home Valuation Report for This Property
The Home Valuation Report is an in-depth analysis detailing your home's value as well as a comparison with similar homes in the area
Home Values in the Area
Average Home Value in this Area
Purchase History
| Date | Buyer | Sale Price | Title Company |
|---|---|---|---|
| Pureber Ryan T | $265,000 | None Available | |
| Stobaugh Steve R | $98,000 | -- | |
| Butler Anthony F | $56,000 | -- |
Source: Public Records
Mortgage History
| Date | Status | Borrower | Loan Amount |
|---|---|---|---|
| Open | Pureber Ryan T | $261,478 | |
| Previous Owner | Stobaugh Steve R | $97,444 | |
| Previous Owner | Butler Anthony F | $56,000 |
Source: Public Records
Tax History Compared to Growth
Tax History
| Year | Tax Paid | Tax Assessment Tax Assessment Total Assessment is a certain percentage of the fair market value that is determined by local assessors to be the total taxable value of land and additions on the property. | Land | Improvement |
|---|---|---|---|---|
| 2024 | $3,965 | $50,060 | $14,710 | $35,350 |
| 2023 | $3,879 | $50,060 | $14,710 | $35,350 |
| 2022 | $3,249 | $40,850 | $15,910 | $24,940 |
| 2021 | $3,135 | $42,020 | $16,370 | $25,650 |
| 2020 | $2,960 | $39,890 | $11,450 | $28,440 |
| 2019 | $2,877 | $39,890 | $11,450 | $28,440 |
| 2018 | $2,652 | $34,280 | $9,890 | $24,390 |
| 2017 | $2,644 | $34,280 | $9,890 | $24,390 |
| 2016 | $2,553 | $31,310 | $7,291 | $24,019 |
| 2015 | $2,315 | $29,630 | $7,291 | $22,339 |
| 2014 | $1,779 | $21,420 | $2,547 | $18,873 |
Source: Public Records
Map
Nearby Homes
- 2551 N York St
- 2207 E 25th Ave
- 2716 Vine St
- 2401 E 28th Ave
- 2841 N Columbine St
- 3664 E 29th Ave
- 3224 High St
- 3222 High St
- 3220 High St
- 1866 E 28th Ave
- 2955 Columbine St
- 2703 N Milwaukee St
- 2558 Gilpin St
- 3042 Vine St
- 3034 N High St
- 3120 N Race St
- 2050 N Gaylord St
- 2239 N Williams St
- 2928 Milwaukee St
- 3139 Vine St
- 2651 Josephine St
- 2639 Josephine St
- 2657 Josephine St
- 2633 Josephine St
- 2627 Josephine St
- 2648 Josephine St
- 2646 York St
- 2650 York St
- 2617 Josephine St
- 2703 Josephine St
- 2660 York St
- 2636 York St
- 2628 Josephine St
- 2656 Josephine St
- 2630 York St
- 2709 Josephine St
- 2611 Josephine St
- 2620 Josephine St
- 2628 N Josephine St
- 2611 N Josephine St