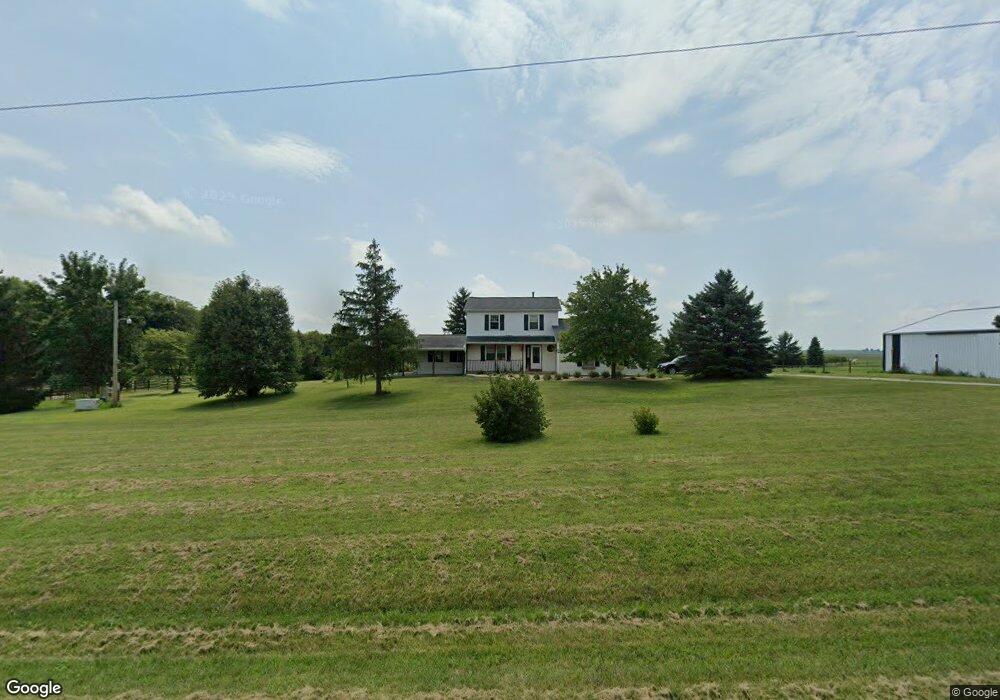
26475 E 800 North Rd Le Roy, IL 61752
Estimated Value: $262,000 - $383,000
2
Beds
2
Baths
2,922
Sq Ft
$115/Sq Ft
Est. Value
About This Home
This home is located at 26475 E 800 North Rd, Le Roy, IL 61752 and is currently estimated at $335,863, approximately $114 per square foot. 26475 E 800 North Rd is a home located in McLean County with nearby schools including Le Roy Elementary School, Le Roy Junior High School, and Le Roy High School.
Ownership History
Date
Name
Owned For
Owner Type
Purchase Details
Closed on
Nov 28, 2014
Sold by
Negi Gurinder S
Bought by
Duncan Valerie R and Hallock Michael J
Current Estimated Value
Home Financials for this Owner
Home Financials are based on the most recent Mortgage that was taken out on this home.
Original Mortgage
$175,500
Interest Rate
3.67%
Mortgage Type
New Conventional
Purchase Details
Closed on
Nov 12, 2014
Sold by
Covington Randolph W
Bought by
Negi Gurinder
Home Financials for this Owner
Home Financials are based on the most recent Mortgage that was taken out on this home.
Original Mortgage
$175,500
Interest Rate
3.67%
Mortgage Type
New Conventional
Purchase Details
Closed on
Apr 15, 2008
Sold by
Boston Michael R and Boston Kathleen S
Bought by
Negi Gurinder and Covington Judith
Home Financials for this Owner
Home Financials are based on the most recent Mortgage that was taken out on this home.
Original Mortgage
$243,447
Interest Rate
6.09%
Create a Home Valuation Report for This Property
The Home Valuation Report is an in-depth analysis detailing your home's value as well as a comparison with similar homes in the area
Purchase History
| Date | Buyer | Sale Price | Title Company |
|---|---|---|---|
| Duncan Valerie R | $225,000 | Mclean County Title | |
| Duncan Valerie R | $225,000 | Mclean County Title | |
| Negi Gurinder | $20,000 | Alliance Land Title | |
| Negi Gurinder | $266,500 | Frontier Title Co |
Source: Public Records
Mortgage History
| Date | Status | Borrower | Loan Amount |
|---|---|---|---|
| Previous Owner | Duncan Valerie R | $175,500 | |
| Previous Owner | Negi Gurinder | $243,447 |
Source: Public Records
Tax History
| Year | Tax Paid | Tax Assessment Tax Assessment Total Assessment is a certain percentage of the fair market value that is determined by local assessors to be the total taxable value of land and additions on the property. | Land | Improvement |
|---|---|---|---|---|
| 2024 | $5,313 | $83,091 | $8,127 | $74,964 |
| 2022 | $5,313 | $71,397 | $6,830 | $64,567 |
| 2021 | $5,130 | $68,340 | $6,471 | $61,869 |
| 2020 | $5,081 | $66,445 | $6,234 | $60,211 |
| 2019 | $5,001 | $66,396 | $6,185 | $60,211 |
| 2018 | $4,968 | $66,396 | $6,185 | $60,211 |
| 2017 | $4,995 | $66,765 | $6,182 | $60,583 |
| 2016 | $4,836 | $65,855 | $6,056 | $59,799 |
| 2015 | $4,713 | $64,196 | $5,856 | $58,340 |
| 2014 | $4,564 | $63,409 | $5,728 | $57,681 |
| 2013 | -- | $63,384 | $5,703 | $57,681 |
Source: Public Records
Map
Nearby Homes
- 4.86 Acre Plot Off County Road 900 N
- 230-005 Wayne St
- 618 Meadow Lane St
- 300 E Warren St
- 902 E Washington St
- 612 E North St
- 410 N Main St
- LOT 6 W Elm St
- 407 W Oak St
- 600 E Cedar St
- 201 S Main St
- 306 E Cedar St
- 200 E South St
- 000 Lot 5 Sunset Dr
- 000 Lot 2 Sunset Dr
- 000 Lot 4 Sunset Dr
- 000 Lot 6 Sunset Dr
- 315 Burcham Dr
- 11629 Oak St
- 108 Cardinal Dr
- 26475 E 800 Rd N
- 26344 E 800 North Rd
- 26130 E 800 North Rd
- 26951 E 800 North Rd
- 8244 N 2675 East Rd
- 7931 N 2600 East Rd
- 7632 N 2700 East Rd
- 8355 N 2600 East Rd
- 8463 N 2600 East Rd
- 8447 N 2600 East Rd
- 25918 E 800n Rd
- 25918 E 800 North Rd
- 8529 N 2600 East Rd
- 8280 N 2600 East Rd
- 8280 N 2600 Rd E
- 25867 E 800 North Rd
- 27158 E 750 North Rd
- 8524 N 2600 East Rd
- 8765 N 2600 East Rd
- 8765 N 2600 East Rd
Your Personal Tour Guide
Ask me questions while you tour the home.