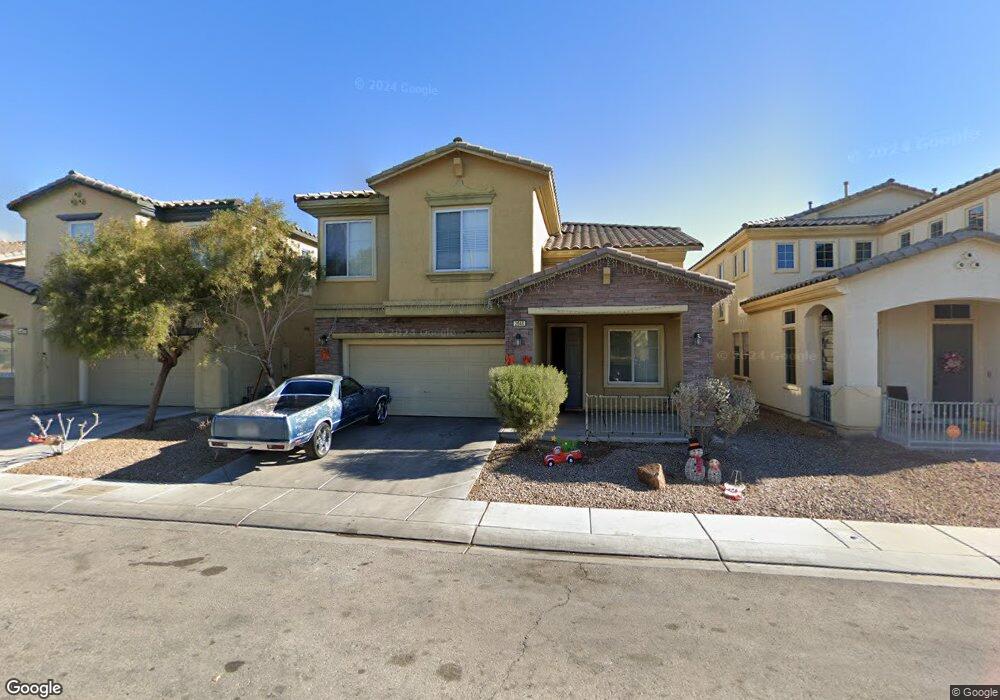
2648 Star Manor St Unit II North Las Vegas, NV 89030
Downtown North Las Vegas NeighborhoodEstimated Value: $358,266 - $654,000
3
Beds
3
Baths
2,195
Sq Ft
$210/Sq Ft
Est. Value
About This Home
This home is located at 2648 Star Manor St Unit II, North Las Vegas, NV 89030 and is currently estimated at $461,567, approximately $210 per square foot. 2648 Star Manor St Unit II is a home located in Clark County with nearby schools including H.P. Fitzgerald Elementary School, West Prepatory Academy At Charlles I West Hall Sec, and Cheyenne High School.
Ownership History
Date
Name
Owned For
Owner Type
Purchase Details
Closed on
Oct 12, 2023
Sold by
Shang Lung Inc Llc
Bought by
Fortune Real Estate 888 Llc
Current Estimated Value
Purchase Details
Closed on
May 17, 2011
Sold by
Secretary Of Housing & Urban Development
Bought by
Shang Lung Inc Llc
Purchase Details
Closed on
May 26, 2010
Sold by
Fountain Thelma
Bought by
Bac Home Loans Servicing Lp and Countrywide Home Loans Servicing Lp
Purchase Details
Closed on
Sep 28, 2007
Sold by
Tousa Homes Inc
Bought by
Fountain Thelma
Home Financials for this Owner
Home Financials are based on the most recent Mortgage that was taken out on this home.
Original Mortgage
$238,829
Interest Rate
6.61%
Mortgage Type
FHA
Create a Home Valuation Report for This Property
The Home Valuation Report is an in-depth analysis detailing your home's value as well as a comparison with similar homes in the area
Home Values in the Area
Average Home Value in this Area
Purchase History
| Date | Buyer | Sale Price | Title Company |
|---|---|---|---|
| Fortune Real Estate 888 Llc | $220,000 | First American Title | |
| Shang Lung Inc Llc | $82,000 | Nevada Title Las Vegas | |
| Bac Home Loans Servicing Lp | $258,110 | Accommodation | |
| The Secretary Of Housing & Urban Develop | $258,110 | Fidelity National Default S | |
| Fountain Thelma | $242,598 | Community Title |
Source: Public Records
Mortgage History
| Date | Status | Borrower | Loan Amount |
|---|---|---|---|
| Previous Owner | Fountain Thelma | $238,829 |
Source: Public Records
Tax History Compared to Growth
Tax History
| Year | Tax Paid | Tax Assessment Tax Assessment Total Assessment is a certain percentage of the fair market value that is determined by local assessors to be the total taxable value of land and additions on the property. | Land | Improvement |
|---|---|---|---|---|
| 2025 | $1,821 | $125,931 | $29,750 | $96,181 |
| 2024 | $1,687 | $125,931 | $29,750 | $96,181 |
| 2023 | $1,687 | $120,698 | $30,100 | $90,598 |
| 2022 | $1,562 | $101,167 | $25,200 | $75,967 |
| 2021 | $1,447 | $90,947 | $23,800 | $67,147 |
| 2020 | $1,341 | $80,923 | $23,800 | $57,123 |
| 2019 | $1,256 | $80,427 | $17,500 | $62,927 |
| 2018 | $1,199 | $70,573 | $15,400 | $55,173 |
| 2017 | $2,113 | $62,987 | $11,550 | $51,437 |
| 2016 | $1,123 | $46,025 | $8,750 | $37,275 |
| 2015 | $1,120 | $40,789 | $7,000 | $33,789 |
| 2014 | $1,085 | $33,972 | $3,500 | $30,472 |
Source: Public Records
Map
Nearby Homes
- 2617 Star Manor St Unit II
- 2621 Rainbow Glow St
- 2539 Tuskegee St
- 1217 Star Meadow Dr
- 2537 Page St
- 0 Windsor Ave Unit 2711938
- 0 Windsor Ave
- 00 Duquesne Ave
- 4 Duquesne Ave
- 2413 Copperbelt St
- 1116 Boylston Ave
- 1120 Boylston Ave
- 2408 Copperbelt St
- 1105 Boylston Ave
- 1108 Boylston Ave
- 1112 Boylston Ave
- 2409 Copperbelt St
- 2405 Copperbelt St
- 00
- 2419 Country Orchard St
- 2644 Star Manor St
- 2652 Star Manor St
- 2656 Star Manor St
- 2640 Star Manor St
- 2649 Concord St
- 2653 Concord St
- 2645 Concord St
- 2657 Concord St
- 2641 Concord St
- 2704 Star Manor St
- 2636 Star Manor St
- 2649 Star Manor St
- 2653 Star Manor St
- 2645 Star Manor St
- 2705 Concord St
- 2637 Concord St
- 2657 Star Manor St
- 2641 Star Manor St Unit II
- 2632 Star Manor St
- 2708 Star Manor St