Estimated Value: $416,000 - $434,000
3
Beds
2
Baths
1,930
Sq Ft
$220/Sq Ft
Est. Value
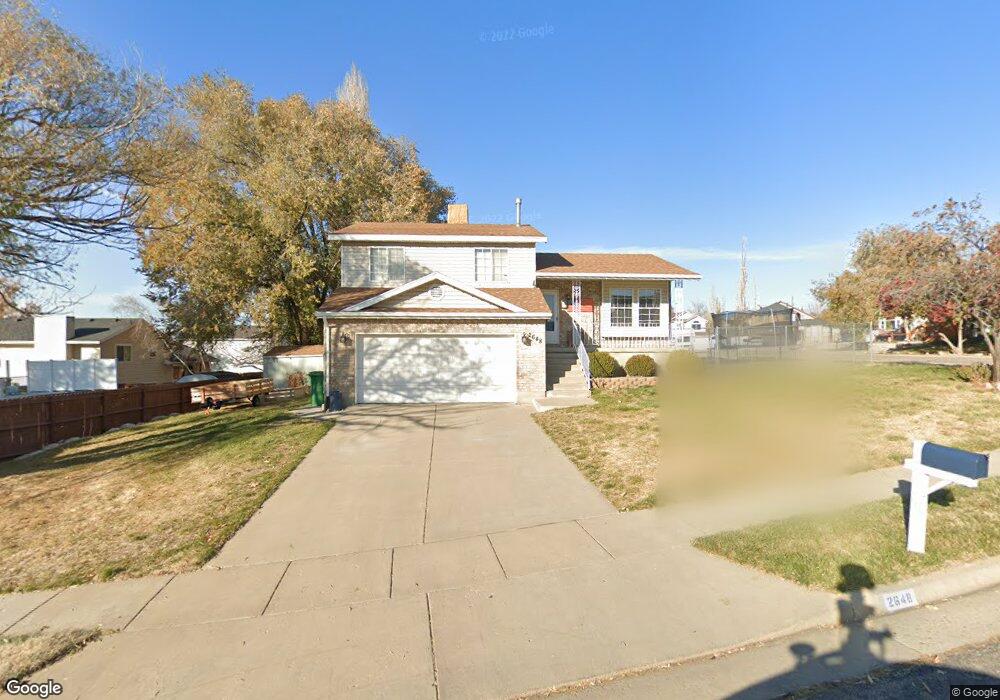
About This Home
This home is located at 2648 W 4750 S, Roy, UT 84067 and is currently estimated at $423,866, approximately $219 per square foot. 2648 W 4750 S is a home located in Weber County with nearby schools including Valley View School, Sand Ridge Junior High School, and Roy High School.
Ownership History
Date
Name
Owned For
Owner Type
Purchase Details
Closed on
Jan 27, 2011
Sold by
Hardy Donna S
Bought by
Orton Troy
Current Estimated Value
Home Financials for this Owner
Home Financials are based on the most recent Mortgage that was taken out on this home.
Original Mortgage
$160,817
Outstanding Balance
$110,252
Interest Rate
4.82%
Mortgage Type
FHA
Estimated Equity
$313,614
Purchase Details
Closed on
Jul 27, 2000
Sold by
Patterson Wayne
Bought by
Hardy Donna S
Home Financials for this Owner
Home Financials are based on the most recent Mortgage that was taken out on this home.
Original Mortgage
$83,200
Interest Rate
8.2%
Mortgage Type
Purchase Money Mortgage
Purchase Details
Closed on
Mar 14, 2000
Sold by
Patterson Sandra Ann
Bought by
Patterson Wayne
Purchase Details
Closed on
May 15, 1996
Sold by
Patterson Wayne P
Bought by
Patterson Wayne and Patterson Sandra Ann
Create a Home Valuation Report for This Property
The Home Valuation Report is an in-depth analysis detailing your home's value as well as a comparison with similar homes in the area
Home Values in the Area
Average Home Value in this Area
Purchase History
| Date | Buyer | Sale Price | Title Company |
|---|---|---|---|
| Orton Troy | -- | Mountain View Title Ogden | |
| Hardy Donna S | -- | Associated Title | |
| Patterson Wayne | -- | Associated Title | |
| Patterson Wayne | -- | Associated Title |
Source: Public Records
Mortgage History
| Date | Status | Borrower | Loan Amount |
|---|---|---|---|
| Open | Orton Troy | $160,817 | |
| Previous Owner | Hardy Donna S | $83,200 | |
| Closed | Hardy Donna S | $22,000 |
Source: Public Records
Tax History
| Year | Tax Paid | Tax Assessment Tax Assessment Total Assessment is a certain percentage of the fair market value that is determined by local assessors to be the total taxable value of land and additions on the property. | Land | Improvement |
|---|---|---|---|---|
| 2025 | $2,555 | $403,853 | $121,801 | $282,052 |
| 2024 | $2,493 | $218,349 | $67,004 | $151,345 |
| 2023 | $2,357 | $206,250 | $63,601 | $142,649 |
| 2022 | $2,512 | $227,700 | $55,604 | $172,096 |
| 2021 | $1,962 | $290,000 | $70,793 | $219,207 |
| 2020 | $1,901 | $259,000 | $70,793 | $188,207 |
| 2019 | $1,792 | $229,000 | $40,633 | $188,367 |
| 2018 | $1,655 | $198,000 | $40,633 | $157,367 |
| 2017 | $1,580 | $177,000 | $40,633 | $136,367 |
| 2016 | $1,540 | $92,833 | $19,461 | $73,372 |
| 2015 | $1,356 | $82,830 | $18,376 | $64,454 |
| 2014 | $1,315 | $79,128 | $18,376 | $60,752 |
Source: Public Records
Map
Nearby Homes
Your Personal Tour Guide
Ask me questions while you tour the home.