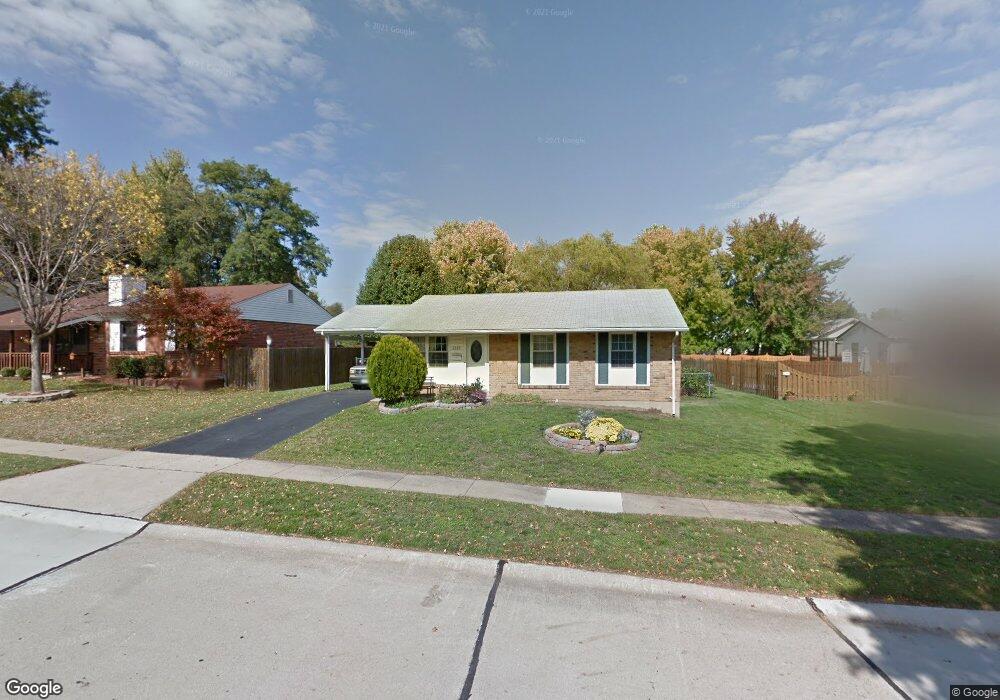
2649 Freemantle Dr Florissant, MO 63031
Estimated Value: $160,000 - $183,000
3
Beds
2
Baths
1,044
Sq Ft
$167/Sq Ft
Est. Value
About This Home
This home is located at 2649 Freemantle Dr, Florissant, MO 63031 and is currently estimated at $174,029, approximately $166 per square foot. 2649 Freemantle Dr is a home located in St. Louis County with nearby schools including Walker Elementary School, Northwest Middle School, and Hazelwood West High School.
Ownership History
Date
Name
Owned For
Owner Type
Purchase Details
Closed on
Dec 5, 2003
Sold by
Peth Robert A and Peth Mary S
Bought by
Lehmann Dale E
Current Estimated Value
Home Financials for this Owner
Home Financials are based on the most recent Mortgage that was taken out on this home.
Original Mortgage
$83,920
Outstanding Balance
$39,267
Interest Rate
6.02%
Mortgage Type
Purchase Money Mortgage
Estimated Equity
$134,762
Purchase Details
Closed on
Feb 4, 2003
Sold by
S & P Properties Inc
Bought by
Peth Robert A and Peth Mary S
Home Financials for this Owner
Home Financials are based on the most recent Mortgage that was taken out on this home.
Original Mortgage
$63,900
Interest Rate
5.9%
Mortgage Type
Seller Take Back
Purchase Details
Closed on
Sep 5, 2002
Sold by
Rudolph Adam W
Bought by
S & P Properties Inc
Purchase Details
Closed on
Nov 22, 1999
Sold by
Huber Michael J and Huber Donna S
Bought by
Rudolph Adam W
Home Financials for this Owner
Home Financials are based on the most recent Mortgage that was taken out on this home.
Original Mortgage
$57,000
Interest Rate
7.93%
Mortgage Type
FHA
Create a Home Valuation Report for This Property
The Home Valuation Report is an in-depth analysis detailing your home's value as well as a comparison with similar homes in the area
Home Values in the Area
Average Home Value in this Area
Purchase History
| Date | Buyer | Sale Price | Title Company |
|---|---|---|---|
| Lehmann Dale E | $104,900 | -- | |
| Peth Robert A | $71,000 | -- | |
| S & P Properties Inc | $60,000 | -- | |
| Rudolph Adam W | $62,000 | -- |
Source: Public Records
Mortgage History
| Date | Status | Borrower | Loan Amount |
|---|---|---|---|
| Open | Lehmann Dale E | $83,920 | |
| Previous Owner | Peth Robert A | $63,900 | |
| Previous Owner | Rudolph Adam W | $57,000 |
Source: Public Records
Tax History Compared to Growth
Tax History
| Year | Tax Paid | Tax Assessment Tax Assessment Total Assessment is a certain percentage of the fair market value that is determined by local assessors to be the total taxable value of land and additions on the property. | Land | Improvement |
|---|---|---|---|---|
| 2025 | $2,195 | $32,120 | $5,420 | $26,700 |
| 2024 | $2,195 | $25,060 | $3,100 | $21,960 |
| 2023 | $2,192 | $25,060 | $3,100 | $21,960 |
| 2022 | $1,957 | $19,910 | $3,550 | $16,360 |
| 2021 | $1,929 | $19,910 | $3,550 | $16,360 |
| 2020 | $1,869 | $17,950 | $3,550 | $14,400 |
| 2019 | $1,840 | $17,950 | $3,550 | $14,400 |
| 2018 | $1,523 | $13,620 | $2,410 | $11,210 |
| 2017 | $1,521 | $13,620 | $2,410 | $11,210 |
| 2016 | $1,654 | $14,630 | $2,790 | $11,840 |
| 2015 | $1,619 | $14,630 | $2,790 | $11,840 |
| 2014 | $1,612 | $15,010 | $3,550 | $11,460 |
Source: Public Records
Map
Nearby Homes
- 2618 Freemantle Dr
- 2235 Central Parkway Dr
- 2106 Kingsford Dr
- 2042 Farflung Dr
- 2314 Stoney End Ct
- 2540 Courtyard Place
- 2347 Farflung Dr
- 2390 Wharton Ct
- 2437 Periwinkle Ct
- 2112 Millvalley Dr
- 1834 Night Dr
- 2216 Foggy Bottom Dr
- 1885 High Sun Dr
- 1907 High Sun Dr
- 1920 High Sun Dr
- 1863 High Sun Dr Unit 51863
- 2112 New Sun Dr
- 1831 New Sun Ct Unit 5
- 1830 New Sun Ct
- 2048 New Sun Dr
- 2639 Freemantle Dr
- 2659 Freemantle Dr
- 2208 Central Parkway Dr
- 2629 Freemantle Dr
- 2212 Central Parkway Dr
- 2658 Freemantle Dr
- 2648 Freemantle Dr
- 2638 Freemantle Dr
- 2216 Central Parkway Dr
- 2668 Freemantle Dr
- 2628 Freemantle Dr
- 2217 Bensonhurst Dr
- 2227 Bensonhurst Dr
- 2237 Bensonhurst Dr
- 2701 Freemantle Dr
- 2186 Central Pkwy
- 2592 Auburnhill Ct
- 2700 Freemantle Dr
- 2608 Freemantle Dr