Estimated Value: $139,000 - $214,000
3
Beds
1
Bath
1,200
Sq Ft
$151/Sq Ft
Est. Value
About This Home
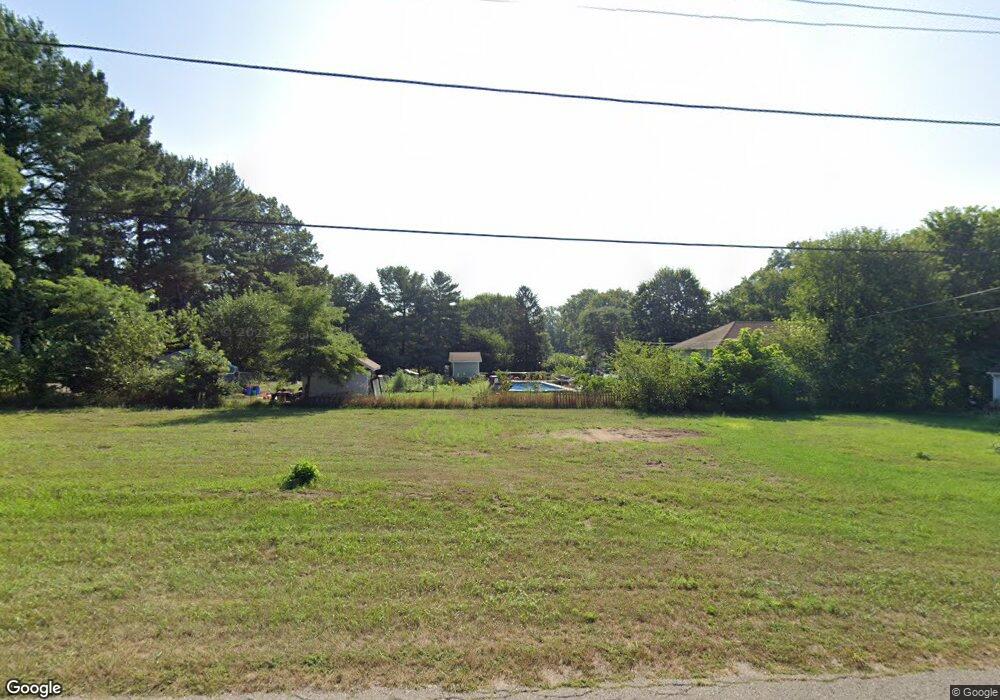
This home is located at 2649 Huntly Rd, Niles, MI 49120 and is currently estimated at $181,201, approximately $151 per square foot. 2649 Huntly Rd is a home located in Cass County with nearby schools including James Ellis School, Howard-Ellis Elementary School, and Ring Lardner Middle School.
Ownership History
Date
Name
Owned For
Owner Type
Purchase Details
Closed on
Jul 28, 2020
Sold by
Grontkowski Emily D
Bought by
Carter Kari A
Current Estimated Value
Home Financials for this Owner
Home Financials are based on the most recent Mortgage that was taken out on this home.
Original Mortgage
$75,757
Outstanding Balance
$67,202
Interest Rate
3%
Mortgage Type
New Conventional
Estimated Equity
$113,999
Purchase Details
Closed on
Jul 25, 2019
Sold by
Iwaniuk Rory P and Grontkowski Emily D
Bought by
Grontkowski Emily D
Create a Home Valuation Report for This Property
The Home Valuation Report is an in-depth analysis detailing your home's value as well as a comparison with similar homes in the area
Home Values in the Area
Average Home Value in this Area
Purchase History
| Date | Buyer | Sale Price | Title Company |
|---|---|---|---|
| Carter Kari A | $75,000 | Chicago Title Of Mi Inc | |
| Grontkowski Emily D | -- | None Available |
Source: Public Records
Mortgage History
| Date | Status | Borrower | Loan Amount |
|---|---|---|---|
| Open | Carter Kari A | $75,757 |
Source: Public Records
Tax History Compared to Growth
Tax History
| Year | Tax Paid | Tax Assessment Tax Assessment Total Assessment is a certain percentage of the fair market value that is determined by local assessors to be the total taxable value of land and additions on the property. | Land | Improvement |
|---|---|---|---|---|
| 2025 | $1,634 | $73,000 | $73,000 | $0 |
| 2024 | $657 | $72,700 | $72,700 | $0 |
| 2023 | $627 | $58,700 | $0 | $0 |
| 2022 | $611 | $59,400 | $0 | $0 |
| 2021 | $1,355 | $55,400 | $0 | $0 |
| 2020 | $984 | $54,500 | $0 | $0 |
| 2019 | $949 | $52,600 | $0 | $0 |
| 2018 | $407 | $40,800 | $0 | $0 |
| 2017 | $399 | $39,000 | $0 | $0 |
| 2016 | $395 | $40,895 | $0 | $0 |
| 2015 | -- | $43,600 | $0 | $0 |
| 2011 | -- | $38,700 | $0 | $0 |
Source: Public Records
Map
Nearby Homes