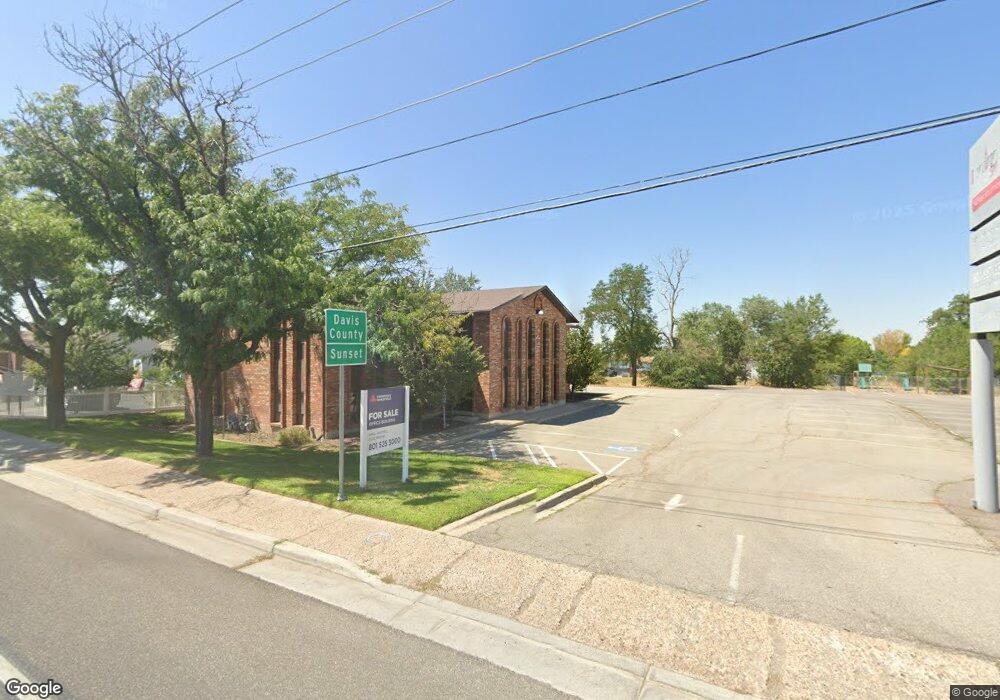
2649 N Main St Clearfield, UT 84015
--
Bed
--
Bath
2,250
Sq Ft
0.41
Acres
About This Home
This home is located at 2649 N Main St, Clearfield, UT 84015. 2649 N Main St is a home located in Weber County with nearby schools including Fremont School, Sunset Junior High School, and Northridge High School.
Ownership History
Date
Name
Owned For
Owner Type
Purchase Details
Closed on
Dec 16, 2020
Sold by
Castlemain Deborah
Bought by
Dutson David S and Castlemain Deborah
Purchase Details
Closed on
Aug 28, 2020
Sold by
Gallego Diana D
Bought by
Dutson David S and Castlemain Deborah
Purchase Details
Closed on
Aug 31, 2017
Sold by
Intra Port Systems Inc
Bought by
Safe Haven Properties Llc
Home Financials for this Owner
Home Financials are based on the most recent Mortgage that was taken out on this home.
Original Mortgage
$205,200
Interest Rate
3.9%
Mortgage Type
Commercial
Create a Home Valuation Report for This Property
The Home Valuation Report is an in-depth analysis detailing your home's value as well as a comparison with similar homes in the area
Home Values in the Area
Average Home Value in this Area
Purchase History
| Date | Buyer | Sale Price | Title Company |
|---|---|---|---|
| Dutson David S | -- | None Available | |
| Dutson David S | -- | None Available | |
| Safe Haven Properties Llc | -- | Backman Title |
Source: Public Records
Mortgage History
| Date | Status | Borrower | Loan Amount |
|---|---|---|---|
| Previous Owner | Safe Haven Properties Llc | $205,200 | |
| Previous Owner | Safe Haven Properties Llc | $256,500 |
Source: Public Records
Tax History Compared to Growth
Tax History
| Year | Tax Paid | Tax Assessment Tax Assessment Total Assessment is a certain percentage of the fair market value that is determined by local assessors to be the total taxable value of land and additions on the property. | Land | Improvement |
|---|---|---|---|---|
| 2025 | $6,862 | $625,914 | $208,804 | $417,110 |
| 2024 | $6,281 | $315,149 | $85,739 | $229,410 |
| 2023 | $6,263 | $315,150 | $85,739 | $229,410 |
| 2022 | $5,103 | $459,450 | $155,890 | $303,560 |
| 2021 | $5,439 | $423,300 | $119,740 | $303,560 |
| 2020 | $5,357 | $410,000 | $99,860 | $310,140 |
| 2019 | $5,352 | $420,094 | $120,212 | $299,882 |
| 2018 | $5,075 | $390,000 | $109,618 | $280,382 |
| 2016 | $4,250 | $305,100 | $53,600 | $251,500 |
| 2015 | $4,486 | $305,100 | $53,600 | $251,500 |
| 2014 | $4,389 | $305,100 | $53,600 | $251,500 |
| 2013 | -- | $302,100 | $53,600 | $248,500 |
Source: Public Records
Map
Nearby Homes
- 2622 N 175 W
- 2622 2125 W
- 2632 2125 W
- 244 W 2575 N
- 5902 S 1900 W
- 350 W 2575 N
- 389 W 2575 N
- 428 W 2650 N
- 2512 N 475 W
- 480 W 2650 N
- 484 W 2650 N
- 2635 N 500 W Unit 45
- 2593 N 500 W Unit 56
- 2612 N 525 W
- 2101 N Main St Unit 205
- 2101 N Main St Unit 203
- 2101 N Main St Unit 409
- 2085 N Main St Unit 409
- 2085 N Main St Unit 108
- 2085 N Main St Unit 401