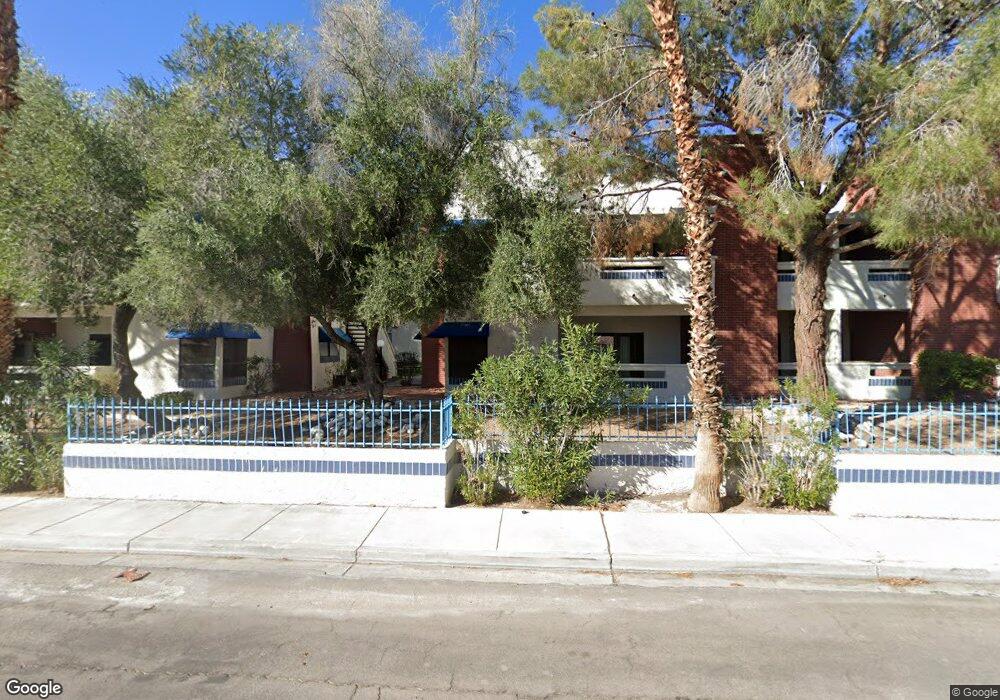
2649 Red Rock St Unit 202 Las Vegas, NV 89146
Estimated Value: $230,878 - $252,000
2
Beds
2
Baths
1,357
Sq Ft
$178/Sq Ft
Est. Value
About This Home
This home is located at 2649 Red Rock St Unit 202, Las Vegas, NV 89146 and is currently estimated at $242,220, approximately $178 per square foot. 2649 Red Rock St Unit 202 is a home located in Clark County with nearby schools including Elaine Wynn Elementary School, Dr. C Owen Roundy Elementary School, and Kenny C Guinn Middle School.
Ownership History
Date
Name
Owned For
Owner Type
Purchase Details
Closed on
Sep 11, 2023
Sold by
Siala M Rafik M and Siala Rafik
Bought by
Rafik Siala Revocable Living Trust and Siala
Current Estimated Value
Create a Home Valuation Report for This Property
The Home Valuation Report is an in-depth analysis detailing your home's value as well as a comparison with similar homes in the area
Home Values in the Area
Average Home Value in this Area
Purchase History
| Date | Buyer | Sale Price | Title Company |
|---|---|---|---|
| Rafik Siala Revocable Living Trust | -- | None Listed On Document |
Source: Public Records
Tax History Compared to Growth
Tax History
| Year | Tax Paid | Tax Assessment Tax Assessment Total Assessment is a certain percentage of the fair market value that is determined by local assessors to be the total taxable value of land and additions on the property. | Land | Improvement |
|---|---|---|---|---|
| 2025 | $650 | $46,772 | $19,600 | $27,172 |
| 2024 | $602 | $46,772 | $19,600 | $27,172 |
| 2023 | $602 | $47,411 | $21,700 | $25,711 |
| 2022 | $558 | $40,127 | $16,100 | $24,027 |
| 2021 | $517 | $38,961 | $15,400 | $23,561 |
| 2020 | $477 | $38,724 | $15,050 | $23,674 |
| 2019 | $447 | $33,697 | $9,975 | $23,722 |
| 2018 | $427 | $30,731 | $7,350 | $23,381 |
| 2017 | $750 | $25,562 | $5,250 | $20,312 |
| 2016 | $401 | $27,970 | $4,550 | $23,420 |
| 2015 | $399 | $21,045 | $4,550 | $16,495 |
| 2014 | $386 | $19,352 | $3,850 | $15,502 |
Source: Public Records
Map
Nearby Homes
- 2625 Westwind Rd
- 2675 Westwind Rd
- 2885 Duneville St
- 0 S Bronco St
- 2780 El Camino Rd
- 5785 Edna Ave
- 5895 Coley Ave
- 6151 Peppermill Dr
- 5991 Obannon Dr
- 5925 Obannon Dr
- 0 Palmyra Unit 2715168
- 2216 Verdinal Dr
- 3085 Duneville St
- 3090 Westwind Rd
- 6316 Peppermill Dr
- 2691 Rimpacific Cir
- 6320 Peppermill Dr
- 6540 Tara Ave
- 3132 El Camino Rd
- 3115 El Camino Rd
- 2649 Red Rock St Unit 101
- 2649 Red Rock St
- 2649 Red Rock St Unit 201
- 2649 Red Rock St Unit 102
- 2643 Red Rock St Unit 101
- 2643 Red Rock St Unit 202
- 2643 Red Rock St Unit 201
- 2643 Red Rock St
- 2667 Red Rock St
- 2667 Red Rock St Unit 202
- 2667 Red Rock St Unit 102
- 2667 Red Rock St Unit 201
- 2667 Red Rock St Unit 101
- 2661 Red Rock St Unit 202
- 2661 Red Rock St Unit 101
- 2661 Red Rock St Unit 201
- 2661 Red Rock St Unit 102
- 2655 Red Rock St Unit 201
- 2655 Red Rock St Unit 11101
- 2655 Red Rock St Unit 202