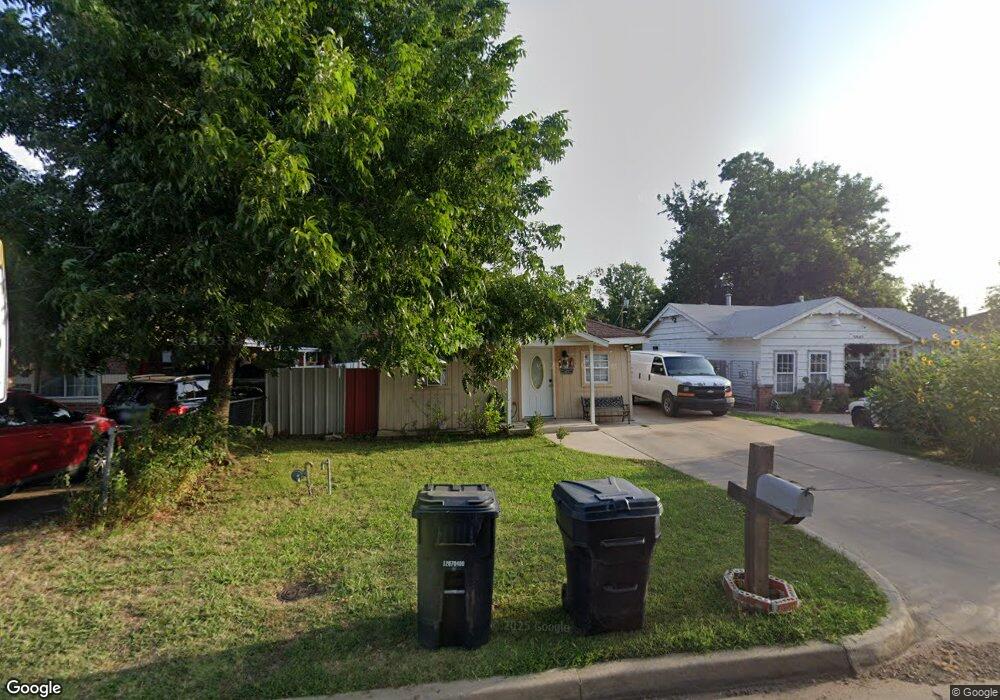
2649 SW 41st St Oklahoma City, OK 73119
Jackson NeighborhoodEstimated Value: $72,415 - $97,000
2
Beds
1
Bath
672
Sq Ft
$126/Sq Ft
Est. Value
About This Home
This home is located at 2649 SW 41st St, Oklahoma City, OK 73119 and is currently estimated at $84,854, approximately $126 per square foot. 2649 SW 41st St is a home located in Oklahoma County with nearby schools including Van Buren Elementary School, Mary Golda Ross Middle School, and Northwest Classen High School.
Ownership History
Date
Name
Owned For
Owner Type
Purchase Details
Closed on
Jul 17, 2024
Sold by
Delgado Jaime and Delgado Maria
Bought by
Villareal Elizabeth and De La Crus
Current Estimated Value
Purchase Details
Closed on
Oct 3, 2012
Sold by
Onebody Properties Llc
Bought by
Villezca Andres and Umanzor Olivia
Purchase Details
Closed on
Sep 26, 2012
Sold by
Lewis Misty Rose and Sims Zebulan Keith
Bought by
Onebody Properties Llc
Purchase Details
Closed on
Jun 25, 2012
Sold by
Hendrix Kayla Sue and Asmussen Kenneth David
Bought by
Onebody Properties Llc
Purchase Details
Closed on
Jun 14, 2012
Sold by
Lewis William Henry
Bought by
Onebody Properties Llc
Purchase Details
Closed on
Jun 8, 2012
Sold by
Lewis Danna Lynn
Bought by
Onebody Properties Llc
Purchase Details
Closed on
Nov 22, 2005
Sold by
Kusler James
Bought by
Lewis Misty and Lewis William
Create a Home Valuation Report for This Property
The Home Valuation Report is an in-depth analysis detailing your home's value as well as a comparison with similar homes in the area
Home Values in the Area
Average Home Value in this Area
Purchase History
| Date | Buyer | Sale Price | Title Company |
|---|---|---|---|
| Villareal Elizabeth | $46,000 | None Listed On Document | |
| Villezca Andres | $13,000 | None Available | |
| Onebody Properties Llc | -- | Os Title | |
| Onebody Properties Llc | $2,000 | None Available | |
| Onebody Properties Llc | $2,000 | None Available | |
| Onebody Properties Llc | $2,000 | None Available | |
| Lewis Misty | -- | -- |
Source: Public Records
Tax History Compared to Growth
Tax History
| Year | Tax Paid | Tax Assessment Tax Assessment Total Assessment is a certain percentage of the fair market value that is determined by local assessors to be the total taxable value of land and additions on the property. | Land | Improvement |
|---|---|---|---|---|
| 2024 | $489 | $4,338 | $735 | $3,603 |
| 2023 | $489 | $4,131 | $854 | $3,277 |
| 2022 | $443 | $3,935 | $981 | $2,954 |
| 2021 | $415 | $3,696 | $1,114 | $2,582 |
| 2020 | $399 | $3,520 | $1,193 | $2,327 |
| 2019 | $402 | $3,565 | $1,172 | $2,393 |
| 2018 | $384 | $3,395 | $0 | $0 |
| 2017 | $366 | $3,233 | $890 | $2,343 |
| 2016 | $349 | $3,079 | $908 | $2,171 |
| 2015 | $346 | $3,027 | $908 | $2,119 |
| 2014 | $327 | $2,882 | $908 | $1,974 |
Source: Public Records
Map
Nearby Homes
- 2644 SW 40th St
- 2625 SW 43rd St
- 2617 SW 43rd St
- 2850 SW 40th St
- 3928 S Agnew Place
- 2912 SW 39th Terrace
- 2504 SW 35th St
- 2829 SW Grand Blvd
- 2408 SW 45th St
- 2700 SW 46th Terrace
- 3916 S Youngs Place
- 3013 SW 40th Place
- 2624 Texoma Dr
- 4316 S Youngs Blvd
- 2725 Texoma Dr
- 2233 SW 40th St
- 2221 SW 42nd St
- 3068 SW 37th Place
- 2539 SW 32nd St
- 2524 SW 49th St
- 2653 SW 41st St
- 2645 SW 41st St
- 2641 SW 41st St
- 2657 SW 41st St
- 2637 SW 41st St
- 2663 SW 41st St
- 2650 SW 40th St
- 2654 SW 40th St
- 2640 SW 40th St
- 2656 SW 40th St
- 2648 SW 41st St
- 2667 SW 41st St
- 2652 SW 41st St
- 2644 SW 41st St
- 2636 SW 40th St
- 2658 SW 40th St
- 2656 SW 41st St
- 2642 SW 41st St
- 2636 SW 41st St
- 2660 SW 40th St