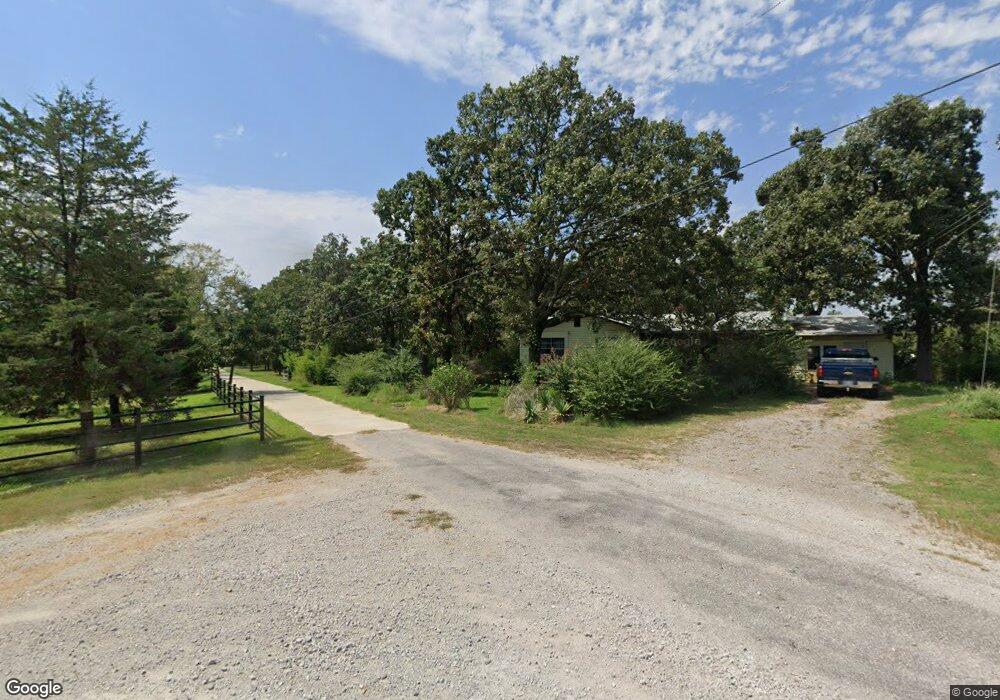
26493 E 146th St S Coweta, OK 74429
Estimated Value: $170,207 - $229,000
--
Bed
1
Bath
1,350
Sq Ft
$152/Sq Ft
Est. Value
About This Home
This home is located at 26493 E 146th St S, Coweta, OK 74429 and is currently estimated at $205,052, approximately $151 per square foot. 26493 E 146th St S is a home located in Wagoner County with nearby schools including Donald P. Sloat Junior High School, Coweta High School, and Coweta Intermediate High School.
Ownership History
Date
Name
Owned For
Owner Type
Purchase Details
Closed on
Jan 7, 2025
Sold by
Rutter Pattie and Rutter Brian C
Bought by
Rutter Pattie and Ryder Teddy
Current Estimated Value
Purchase Details
Closed on
Oct 20, 2022
Sold by
Russell Edward A and Russell Brenda J
Bought by
Russell Scott A and Russell Sarah J
Home Financials for this Owner
Home Financials are based on the most recent Mortgage that was taken out on this home.
Original Mortgage
$667,880
Interest Rate
6.7%
Mortgage Type
Construction
Purchase Details
Closed on
Apr 18, 2016
Sold by
Ryder Ronnie Lee
Bought by
Pattie Ronnie Lee Ryder and Ryder Ann Rutter Teddy W
Purchase Details
Closed on
Jul 28, 2008
Sold by
Ryder Patsy Besnice
Bought by
Ryder Patsy Besnice and Ryder Ronnie Lee
Purchase Details
Closed on
Sep 5, 2003
Sold by
Ryder Patsy Bernice
Purchase Details
Closed on
Jun 30, 1976
Sold by
Ryder Floyd
Create a Home Valuation Report for This Property
The Home Valuation Report is an in-depth analysis detailing your home's value as well as a comparison with similar homes in the area
Home Values in the Area
Average Home Value in this Area
Purchase History
| Date | Buyer | Sale Price | Title Company |
|---|---|---|---|
| Rutter Pattie | -- | None Listed On Document | |
| Rutter Pattie | -- | None Listed On Document | |
| Russell Scott A | -- | -- | |
| Pattie Ronnie Lee Ryder | -- | None Available | |
| Ryder Patsy Besnice | -- | None Available | |
| -- | -- | -- | |
| -- | -- | -- |
Source: Public Records
Mortgage History
| Date | Status | Borrower | Loan Amount |
|---|---|---|---|
| Previous Owner | Russell Scott A | $667,880 |
Source: Public Records
Tax History Compared to Growth
Tax History
| Year | Tax Paid | Tax Assessment Tax Assessment Total Assessment is a certain percentage of the fair market value that is determined by local assessors to be the total taxable value of land and additions on the property. | Land | Improvement |
|---|---|---|---|---|
| 2025 | $191 | $4,021 | $1,181 | $2,840 |
| 2024 | $191 | $4,022 | $1,294 | $2,728 |
| 2023 | $191 | $4,021 | $1,207 | $2,814 |
| 2022 | $189 | $4,021 | $1,187 | $2,834 |
| 2021 | $193 | $4,021 | $1,092 | $2,929 |
| 2020 | $188 | $4,021 | $1,384 | $2,637 |
| 2019 | $191 | $4,021 | $1,440 | $2,581 |
| 2018 | $196 | $4,022 | $1,208 | $2,814 |
| 2017 | $192 | $4,021 | $1,195 | $2,826 |
| 2016 | $192 | $4,022 | $1,404 | $2,618 |
| 2015 | $201 | $4,022 | $1,460 | $2,562 |
| 2014 | $200 | $4,022 | $1,225 | $2,797 |
Source: Public Records
Map
Nearby Homes
- 26640 E 143rd St S
- 26822 E 143rd St S
- 0 E 141st St S Unit 2536501
- 14025 S 261st East Ave
- 14709 S 274th East Ave
- 14751 S 274th East Ave
- 13751 S 261st East Ave
- 27920 E 118th Place S
- 27942 E 118th Place S
- 27960 E 118th Place S
- 27970 E 118th Place S
- 27980 E 118th Place S
- 28000 E 118th Place S
- 28010 E 118th Place S
- 10815 S 278th East Ave
- 13606 S 261st East Ave
- 28030 E 118th Place S
- 28247 E 118th Place S
- 28294 E 118th Place S
- 28070 E 150th Place S
- 0 E 146th St Unit 531155
- 0 E 146th St Unit 531170
- 0 E 146th St Unit 711346
- 0 E 146th St Unit 505859
- 0 E 146th St Unit 617083
- 0 E 146th St Unit 617084
- 0 E 146th St Unit 2216308
- 26489 E 146th St S
- 24648 E 145th St S
- 26703 E 146th St S
- 26860 E 146th St S
- 26661 E 149th St S
- 14351 S 264th East Ave
- 26388 E 143rd Place S
- 14331 S 264th East Ave
- 26936 E 146th St S
- 26592 E 149th St S
- 26606 E 149th St S
- 26370 E 143rd Place S
- 14311 S 264th East Ave