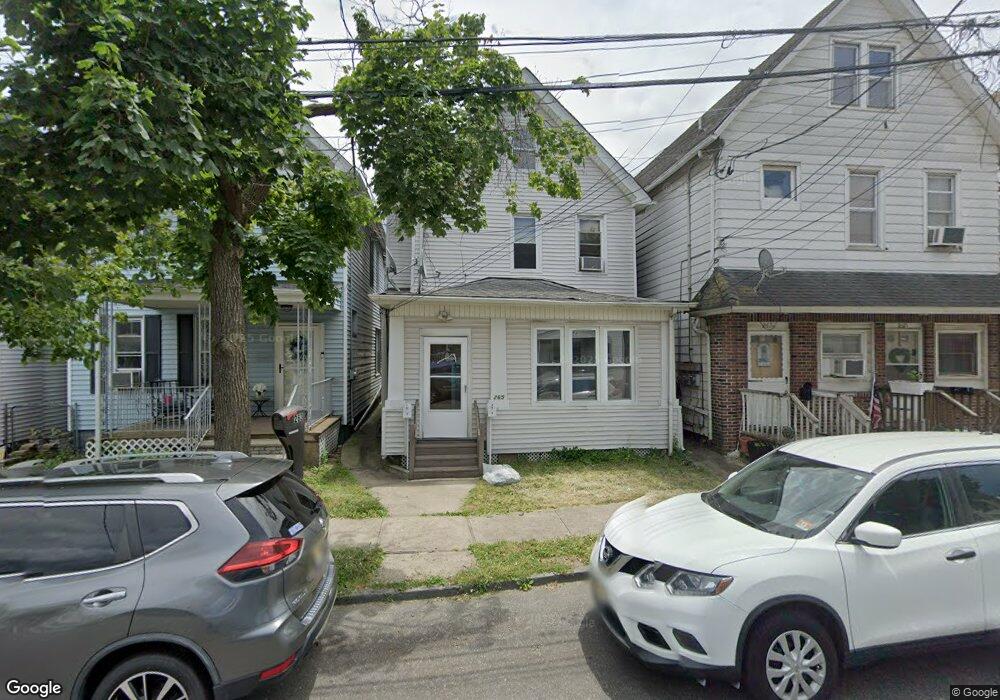
265 1st St South Amboy, NJ 08879
Estimated Value: $285,000 - $466,000
--
Bed
--
Bath
1,522
Sq Ft
$271/Sq Ft
Est. Value
About This Home
This home is located at 265 1st St, South Amboy, NJ 08879 and is currently estimated at $412,941, approximately $271 per square foot. 265 1st St is a home located in Middlesex County with nearby schools including South Amboy Elementary School, South Amboy Middle/High School, and St. Mary Elementary School.
Ownership History
Date
Name
Owned For
Owner Type
Purchase Details
Closed on
Jan 7, 2015
Sold by
The Federal Home Loan Mortgage Corp
Bought by
Modzelewski Antoni
Current Estimated Value
Purchase Details
Closed on
Feb 18, 1999
Sold by
Olchanskey Richard
Bought by
Vrabel Stephen
Home Financials for this Owner
Home Financials are based on the most recent Mortgage that was taken out on this home.
Original Mortgage
$93,750
Interest Rate
6.76%
Purchase Details
Closed on
Jul 31, 1996
Sold by
Olchaskey Richard
Bought by
Vrabel Stephen
Home Financials for this Owner
Home Financials are based on the most recent Mortgage that was taken out on this home.
Original Mortgage
$95,000
Interest Rate
8.27%
Purchase Details
Closed on
May 17, 1995
Sold by
Vona Michael
Bought by
Olchaskey Richard
Create a Home Valuation Report for This Property
The Home Valuation Report is an in-depth analysis detailing your home's value as well as a comparison with similar homes in the area
Home Values in the Area
Average Home Value in this Area
Purchase History
| Date | Buyer | Sale Price | Title Company |
|---|---|---|---|
| Modzelewski Antoni | $130,000 | East Coast Title Agency | |
| Vrabel Stephen | $125,000 | -- | |
| Vrabel Stephen | $115,000 | -- | |
| Olchaskey Richard | $85,000 | -- |
Source: Public Records
Mortgage History
| Date | Status | Borrower | Loan Amount |
|---|---|---|---|
| Previous Owner | Vrabel Stephen | $93,750 | |
| Previous Owner | Vrabel Stephen | $95,000 |
Source: Public Records
Tax History Compared to Growth
Tax History
| Year | Tax Paid | Tax Assessment Tax Assessment Total Assessment is a certain percentage of the fair market value that is determined by local assessors to be the total taxable value of land and additions on the property. | Land | Improvement |
|---|---|---|---|---|
| 2025 | $7,888 | $245,800 | $112,200 | $133,600 |
| 2024 | $7,590 | $245,800 | $112,200 | $133,600 |
| 2023 | $7,590 | $245,800 | $112,200 | $133,600 |
| 2022 | $7,212 | $245,800 | $112,200 | $133,600 |
| 2021 | $7,091 | $245,800 | $112,200 | $133,600 |
| 2020 | $6,924 | $245,800 | $112,200 | $133,600 |
| 2019 | $6,814 | $245,800 | $112,200 | $133,600 |
| 2018 | $6,757 | $245,800 | $112,200 | $133,600 |
| 2017 | $6,649 | $245,800 | $112,200 | $133,600 |
| 2016 | $6,482 | $245,800 | $112,200 | $133,600 |
| 2015 | $6,528 | $245,800 | $112,200 | $133,600 |
| 2014 | $6,305 | $245,800 | $112,200 | $133,600 |
Source: Public Records
Map
Nearby Homes