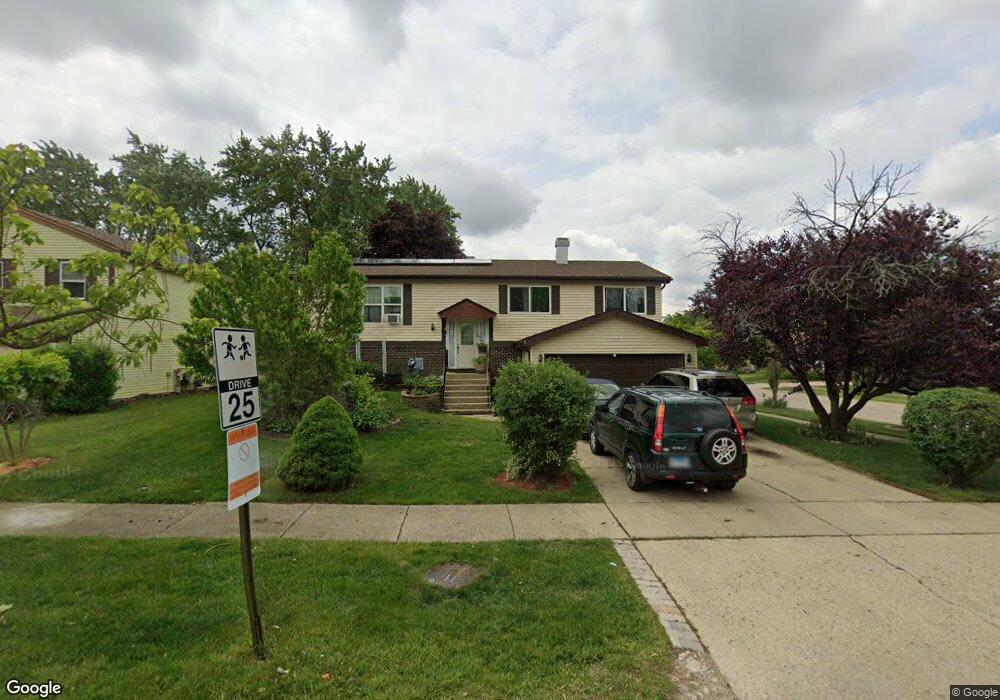
265 Bryant Way Bolingbrook, IL 60440
East Bolingbrook NeighborhoodEstimated Value: $351,930 - $386,000
3
Beds
2
Baths
2,220
Sq Ft
$167/Sq Ft
Est. Value
About This Home
This home is located at 265 Bryant Way, Bolingbrook, IL 60440 and is currently estimated at $371,733, approximately $167 per square foot. 265 Bryant Way is a home located in Will County with nearby schools including Oak View Elementary School, Bolingbrook High School, and Midwest Christian Montessori Academy.
Ownership History
Date
Name
Owned For
Owner Type
Purchase Details
Closed on
Apr 25, 2013
Sold by
Castrejon Pablo S and Castrejon Cristino
Bought by
Castrejon Cristino
Current Estimated Value
Home Financials for this Owner
Home Financials are based on the most recent Mortgage that was taken out on this home.
Original Mortgage
$148,439
Outstanding Balance
$106,096
Interest Rate
3.75%
Mortgage Type
FHA
Estimated Equity
$265,637
Purchase Details
Closed on
Aug 8, 2003
Sold by
Roney Jason S and Roney Lisa J
Bought by
Castrejon Pablo S and Castrejon Cristino
Home Financials for this Owner
Home Financials are based on the most recent Mortgage that was taken out on this home.
Original Mortgage
$190,820
Interest Rate
6.18%
Mortgage Type
FHA
Purchase Details
Closed on
Jul 31, 2000
Sold by
Sadowski Bruno C and Sadowski Margaret A
Bought by
Roney Jason S and Roney Lisa J
Home Financials for this Owner
Home Financials are based on the most recent Mortgage that was taken out on this home.
Original Mortgage
$138,957
Interest Rate
8.19%
Mortgage Type
FHA
Create a Home Valuation Report for This Property
The Home Valuation Report is an in-depth analysis detailing your home's value as well as a comparison with similar homes in the area
Home Values in the Area
Average Home Value in this Area
Purchase History
| Date | Buyer | Sale Price | Title Company |
|---|---|---|---|
| Castrejon Cristino | -- | Fidelity National Title | |
| Castrejon Pablo S | $194,000 | The Title Co Llc | |
| Roney Jason S | $156,000 | Law Title Pick Up |
Source: Public Records
Mortgage History
| Date | Status | Borrower | Loan Amount |
|---|---|---|---|
| Open | Castrejon Cristino | $148,439 | |
| Closed | Castrejon Pablo S | $190,820 | |
| Previous Owner | Roney Jason S | $138,957 |
Source: Public Records
Tax History
| Year | Tax Paid | Tax Assessment Tax Assessment Total Assessment is a certain percentage of the fair market value that is determined by local assessors to be the total taxable value of land and additions on the property. | Land | Improvement |
|---|---|---|---|---|
| 2024 | $9,159 | $107,175 | $21,243 | $85,932 |
| 2023 | $9,159 | $96,433 | $19,114 | $77,319 |
| 2022 | $7,730 | $84,207 | $16,730 | $67,477 |
| 2021 | $7,323 | $78,735 | $15,643 | $63,092 |
| 2020 | $7,095 | $76,146 | $15,129 | $61,017 |
| 2019 | $6,863 | $72,520 | $14,409 | $58,111 |
| 2018 | $6,445 | $68,049 | $13,521 | $54,528 |
| 2017 | $6,132 | $64,501 | $12,816 | $51,685 |
| 2016 | $5,949 | $61,400 | $12,200 | $49,200 |
| 2015 | $5,871 | $58,900 | $11,700 | $47,200 |
| 2014 | $5,871 | $58,900 | $11,700 | $47,200 |
| 2013 | $5,871 | $55,000 | $10,900 | $44,100 |
Source: Public Records
Map
Nearby Homes
- 261 Bryant Way
- 662 Sundance Dr
- 345 Redwing Dr Unit 5
- 228 Elkhorn Ct Unit B
- 556 Pontiac Ln Unit 5
- 240 Chippewa Ct Unit B
- VACANT W Boughton Rd
- 224 Kedvale Ct
- 336 Ozark Dr
- 4 Franklin Ct Unit 2
- 443 Seneca Ln
- 118 Springleaf Dr Unit 5
- 164 Galewood Dr
- 845 Barclay Dr
- 10 Lindsey Ct W
- 161 Oakwood Dr
- 209 Bunker Hill Dr
- 204 Mill Stream Dr
- 209 Mill Stream Dr
- 217 S Orchard Dr
- 256 Whitewater Dr
- 272 Bryant Way
- 253 Windsor Dr
- 252 Whitewater Dr
- 282 Bryant Way
- 257 Whitewater Dr
- 278 Bryant Way
- 249 Windsor Dr
- 268 Bryant Way
- 274 Bryant Way
- 293 Bryant Way
- 253 Whitewater Dr
- 248 Whitewater Dr
- 245 Windsor Dr
- 289 Bryant Way
- 270 Bryant Way
- 249 Whitewater Dr
- 260 Yellow Pine Dr
- 264 Bryant Way
- 244 Whitewater Dr
Your Personal Tour Guide
Ask me questions while you tour the home.