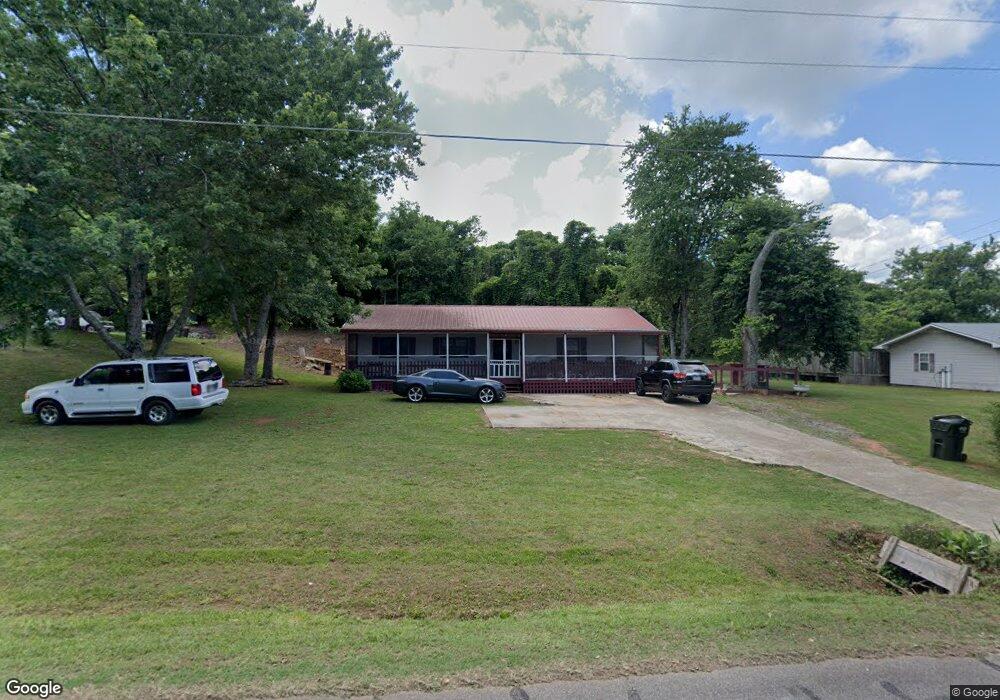
265 Chatham St Baldwin, GA 30511
Estimated Value: $159,000 - $221,142
3
Beds
1
Bath
1,352
Sq Ft
$143/Sq Ft
Est. Value
About This Home
This home is located at 265 Chatham St, Baldwin, GA 30511 and is currently estimated at $192,786, approximately $142 per square foot. 265 Chatham St is a home located in Habersham County with nearby schools including Baldwin Elementary School, South Habersham Middle School, and Habersham Success Academy.
Ownership History
Date
Name
Owned For
Owner Type
Purchase Details
Closed on
Dec 9, 2024
Sold by
Martinez Cipriano
Bought by
Martinez Yeraldin Hernandez
Current Estimated Value
Purchase Details
Closed on
Dec 21, 2016
Bought by
Martinez Cipriano
Home Financials for this Owner
Home Financials are based on the most recent Mortgage that was taken out on this home.
Original Mortgage
$61,616
Interest Rate
4.03%
Mortgage Type
New Conventional
Purchase Details
Closed on
Aug 2, 2016
Sold by
Charles E
Bought by
Jpmorgan Chase Bank National A
Purchase Details
Closed on
Jul 23, 2010
Sold by
Addis Dennis W
Bought by
Freeman Charles E
Home Financials for this Owner
Home Financials are based on the most recent Mortgage that was taken out on this home.
Original Mortgage
$77,050
Interest Rate
4.7%
Mortgage Type
New Conventional
Create a Home Valuation Report for This Property
The Home Valuation Report is an in-depth analysis detailing your home's value as well as a comparison with similar homes in the area
Home Values in the Area
Average Home Value in this Area
Purchase History
| Date | Buyer | Sale Price | Title Company |
|---|---|---|---|
| Martinez Yeraldin Hernandez | -- | -- | |
| Martinez Cipriano | $61,000 | -- | |
| Jpmorgan Chase Bank National A | -- | -- | |
| Freeman Charles E | $69,900 | -- |
Source: Public Records
Mortgage History
| Date | Status | Borrower | Loan Amount |
|---|---|---|---|
| Previous Owner | Martinez Cipriano | $61,616 | |
| Previous Owner | Freeman Charles E | $77,050 |
Source: Public Records
Tax History
| Year | Tax Paid | Tax Assessment Tax Assessment Total Assessment is a certain percentage of the fair market value that is determined by local assessors to be the total taxable value of land and additions on the property. | Land | Improvement |
|---|---|---|---|---|
| 2025 | $2,071 | $63,446 | $11,200 | $52,246 |
| 2024 | $1,382 | $53,256 | $5,600 | $47,656 |
| 2023 | $1,129 | $45,152 | $5,600 | $39,552 |
| 2022 | $1,003 | $38,448 | $4,480 | $33,968 |
| 2021 | $906 | $34,920 | $4,480 | $30,440 |
| 2020 | $827 | $30,756 | $4,480 | $26,276 |
| 2019 | $828 | $30,756 | $4,480 | $26,276 |
| 2018 | $822 | $30,756 | $4,480 | $26,276 |
| 2017 | $655 | $24,400 | $2,928 | $21,472 |
| 2016 | $712 | $68,310 | $3,360 | $23,964 |
| 2015 | $704 | $68,310 | $3,360 | $23,964 |
| 2014 | $705 | $67,150 | $3,360 | $23,500 |
| 2013 | -- | $26,860 | $3,360 | $23,500 |
Source: Public Records
Map
Nearby Homes
- 392 King St
- 155 Dilmus Ct
- 800 Park Ave
- LOT 6 Parker Point
- 0 Georgia 105
- 0 Highway 105 Unit 10421143
- 0 Baldwin Heights Rd Unit 10697704
- 0 Highway 441 Bypass Unit 10428967
- 0 Purvis Rd Unit 10698457
- 170 Sequoyah Dr
- 212 Magnolia Villas Dr
- 304 Magnolia Villas Dr
- 266 Magnolia Villas Dr
- 285 Magnolia Villas Dr
- 722 Pathway Cir
- 167 South St
- 662 Forest Way
- 657 Forest Way
- 661 Forest Way
- 524 Creek Rd
- 241 Chatham St
- 309 Chatham St
- 278 Chatham St
- 170 Chatham St
- 156 Williams St
- 181 Chandler St
- 345 Chatham St Unit A
- 150 Williams St
- 240 Cotton Dr
- 177 Williams St
- 230 Chatham St
- 106 Laredo Dr
- 106 Laredo Dr
- 101 Yonah View Dr
- 106/110 Laredo Dr
- 105 Yonah View Dr
- 155 Williams St
- 385 Chatham St
- 124 Williams St
- 124 Williams St
Your Personal Tour Guide
Ask me questions while you tour the home.