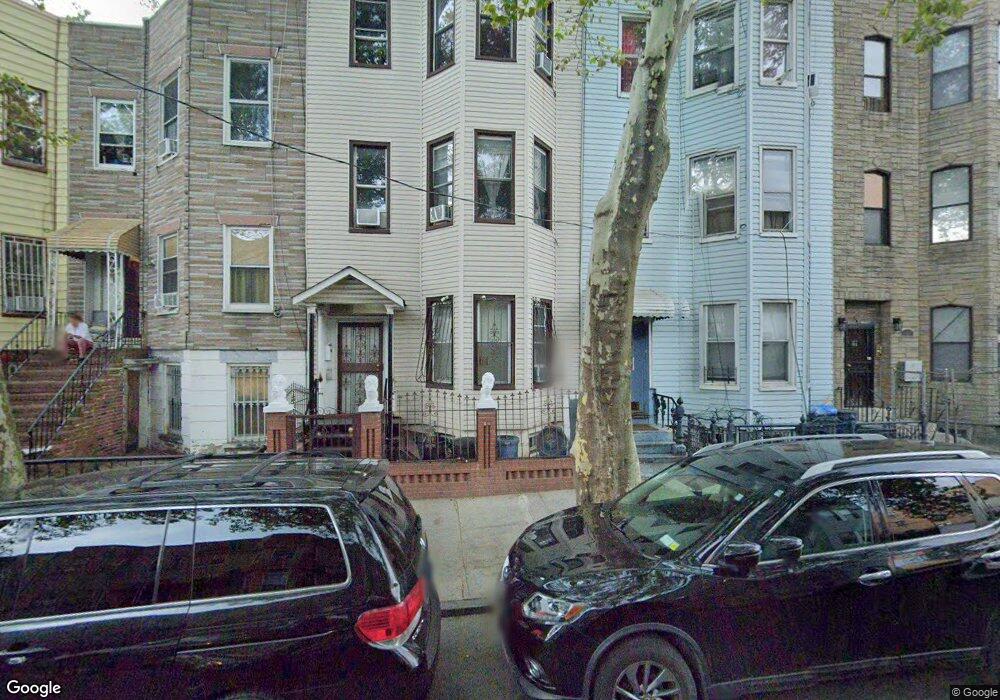
265 Covert St Unit 2 Brooklyn, NY 11207
Bushwick NeighborhoodEstimated Value: $1,224,000 - $1,408,000
3
Beds
2
Baths
3,300
Sq Ft
$398/Sq Ft
Est. Value
About This Home
This home is located at 265 Covert St Unit 2, Brooklyn, NY 11207 and is currently estimated at $1,313,817, approximately $398 per square foot. 265 Covert St Unit 2 is a home located in Kings County with nearby schools including P.S. /I.S. 384 Frances E. Carter, Evergreen Middle School for Urban Exploration, and Achievement First Bushwick Charter School.
Ownership History
Date
Name
Owned For
Owner Type
Purchase Details
Closed on
Mar 6, 2025
Sold by
265 Covert Gole Llc
Bought by
265 Covert St Llc
Current Estimated Value
Home Financials for this Owner
Home Financials are based on the most recent Mortgage that was taken out on this home.
Original Mortgage
$950,000
Outstanding Balance
$943,479
Interest Rate
6.87%
Mortgage Type
Purchase Money Mortgage
Estimated Equity
$370,338
Purchase Details
Closed on
Mar 25, 2024
Sold by
Referee Mark A. Longo Esq.
Bought by
265 Covert Gole Llc
Purchase Details
Closed on
Jan 30, 2007
Sold by
Scott Patricia
Bought by
Scott Morris and Scott Patricia
Purchase Details
Closed on
Nov 24, 1998
Sold by
Riley Lucille
Bought by
Scott Patricia
Home Financials for this Owner
Home Financials are based on the most recent Mortgage that was taken out on this home.
Original Mortgage
$155,431
Interest Rate
6.74%
Mortgage Type
FHA
Create a Home Valuation Report for This Property
The Home Valuation Report is an in-depth analysis detailing your home's value as well as a comparison with similar homes in the area
Home Values in the Area
Average Home Value in this Area
Purchase History
| Date | Buyer | Sale Price | Title Company |
|---|---|---|---|
| 265 Covert St Llc | $1,249,500 | -- | |
| 265 Covert St Llc | $1,249,500 | -- | |
| 265 Covert Gole Llc | $1,120,075 | -- | |
| 265 Covert Gole Llc | $1,120,075 | -- | |
| 265 Covert Gole Llc | $1,120,075 | -- | |
| Scott Morris | -- | -- | |
| Scott Morris | -- | -- | |
| Scott Patricia | $155,000 | Commonwealth Land Title Ins | |
| Scott Patricia | $155,000 | Commonwealth Land Title Ins |
Source: Public Records
Mortgage History
| Date | Status | Borrower | Loan Amount |
|---|---|---|---|
| Open | 265 Covert St Llc | $950,000 | |
| Closed | 265 Covert St Llc | $950,000 | |
| Previous Owner | Scott Patricia | $155,431 | |
| Closed | Scott Morris | $0 |
Source: Public Records
Map
Nearby Homes
- 255 Covert St
- 831 Knickerbocker Ave Unit 2C
- 831 Knickerbocker Ave Unit 3B
- 831 Knickerbocker Ave Unit 4C
- 831 Knickerbocker Ave Unit 2A
- 831 Knickerbocker Ave Unit 2B
- 854 Knickerbocker Ave
- 235 Covert St
- 295 Schaefer St
- 1231 Halsey St
- 302 Weirfield St
- 265 Weirfield St Unit 3-B
- 265 Weirfield St Unit PH-A
- 265 Weirfield St Unit PH-B
- 265 Weirfield St Unit Garden B
- 891 Knickerbocker Ave
- 237 Cooper St
- 900 Knickerbocker Ave Unit 3B
- 627 Wilson Ave Unit 2
- 341 Weirfield St
- 265 Covert St
- 267 Covert St
- 267 Covert St Unit 3.3
- 267 Covert St Unit 1.2
- 267 Covert St Unit 3.5
- 267 Covert St Unit 3.4
- 267 Covert St Unit 3
- 267 Covert St Unit 2
- 267 Covert St Unit 1
- 263 Covert St
- 259 Covert St
- 257 Covert St
- 820 Knickerbocker Ave
- 253 Covert St
- 816 Knickerbocker Ave
- 816 Knickerbocker Ave Unit 4-L
- 278 Eldert St
- 278 Eldert St
- 822 Knickerbocker Ave Unit 1 R
- 822 Knickerbocker Ave Unit 1FR
Your Personal Tour Guide
Ask me questions while you tour the home.