Estimated Value: $532,000 - $604,474
3
Beds
3
Baths
2,277
Sq Ft
$253/Sq Ft
Est. Value
About This Home
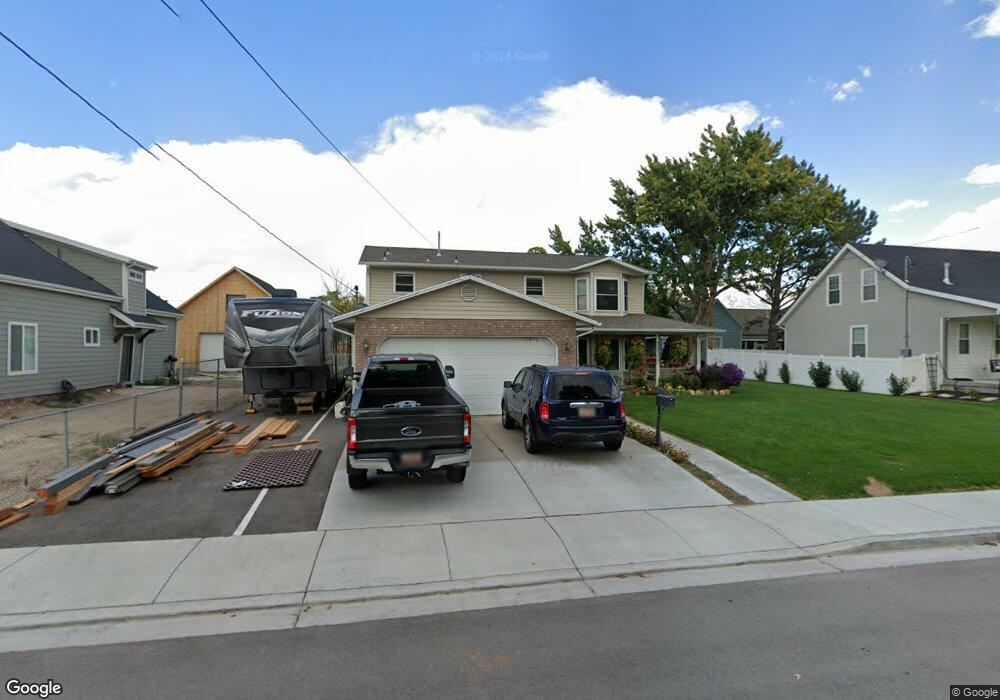
This home is located at 265 E 400 N, Lehi, UT 84043 and is currently estimated at $576,158, approximately $253 per square foot. 265 E 400 N is a home located in Utah County with nearby schools including Lehi Elementary School, Lehi Junior High School, and Lehi High School.
Ownership History
Date
Name
Owned For
Owner Type
Purchase Details
Closed on
Mar 21, 2003
Sold by
Gray James Bert and Gray Rebecca
Bought by
Gray James Bert
Current Estimated Value
Home Financials for this Owner
Home Financials are based on the most recent Mortgage that was taken out on this home.
Original Mortgage
$163,200
Interest Rate
5.79%
Purchase Details
Closed on
Nov 6, 2001
Sold by
Gray James Bert
Bought by
Gray James Bert and Gray Rebecca
Home Financials for this Owner
Home Financials are based on the most recent Mortgage that was taken out on this home.
Original Mortgage
$163,200
Interest Rate
6.73%
Create a Home Valuation Report for This Property
The Home Valuation Report is an in-depth analysis detailing your home's value as well as a comparison with similar homes in the area
Home Values in the Area
Average Home Value in this Area
Purchase History
| Date | Buyer | Sale Price | Title Company |
|---|---|---|---|
| Gray James Bert | -- | Signature Title | |
| Gray James Bert | -- | Signature Title | |
| Gray James Bert | -- | Signature Title |
Source: Public Records
Mortgage History
| Date | Status | Borrower | Loan Amount |
|---|---|---|---|
| Closed | Gray James Bert | $163,200 | |
| Closed | Gray James Bert | $163,200 |
Source: Public Records
Tax History
| Year | Tax Paid | Tax Assessment Tax Assessment Total Assessment is a certain percentage of the fair market value that is determined by local assessors to be the total taxable value of land and additions on the property. | Land | Improvement |
|---|---|---|---|---|
| 2025 | $2,347 | $304,700 | -- | -- |
| 2024 | $2,347 | $274,615 | $0 | $0 |
| 2023 | $2,196 | $279,070 | $0 | $0 |
| 2022 | $2,212 | $272,470 | $0 | $0 |
| 2021 | $1,981 | $368,900 | $114,600 | $254,300 |
| 2020 | $1,868 | $343,800 | $106,100 | $237,700 |
| 2019 | $1,635 | $312,800 | $106,100 | $206,700 |
| 2018 | $1,647 | $297,900 | $97,000 | $200,900 |
| 2017 | $1,574 | $151,415 | $0 | $0 |
| 2016 | $1,586 | $141,570 | $0 | $0 |
| 2015 | $1,489 | $126,115 | $0 | $0 |
| 2014 | $1,350 | $113,685 | $0 | $0 |
Source: Public Records
Map
Nearby Homes
- 160 E 400 N
- 428 E 500 N
- 595 S 600 E
- 281 N Center St
- 395 N 100 W
- 52 W State St
- 68 W State St
- 255 W 100 N
- 762 S 450 E
- 155 W State St Unit TRLR 3
- 406 W 600 N
- 430 N 470 W Unit 17
- 430 N 470 W Unit 29
- 509 E 300 S
- 890 N Whipple Dr
- 197 W Harvest Ln
- 1150 N 200 W Unit 6
- 230 W State St
- 1329 N 100 E Unit 21
- 207 W 500 S
Your Personal Tour Guide
Ask me questions while you tour the home.