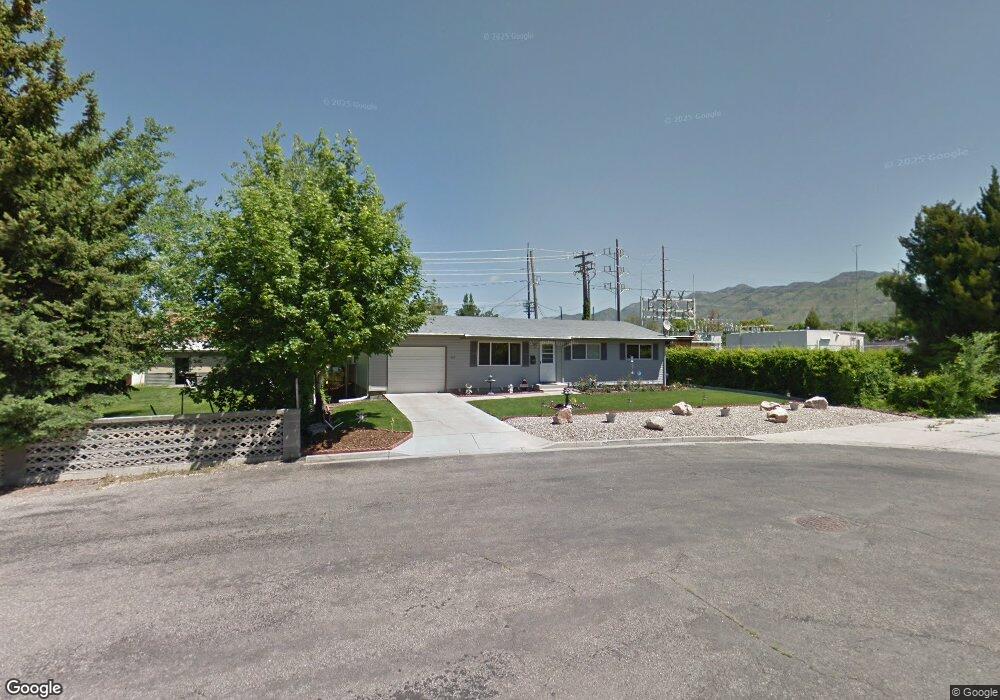
265 E 970 N Logan, UT 84321
Adams NeighborhoodEstimated Value: $326,000 - $367,000
3
Beds
1
Bath
1,073
Sq Ft
$332/Sq Ft
Est. Value
About This Home
This home is located at 265 E 970 N, Logan, UT 84321 and is currently estimated at $356,290, approximately $332 per square foot. 265 E 970 N is a home located in Cache County with nearby schools including Adams Elementary School, Mount Logan Middle School, and Logan High School.
Ownership History
Date
Name
Owned For
Owner Type
Purchase Details
Closed on
Oct 28, 2019
Sold by
Nielsen Becky Lee and The Becky Lee Nielsen Family T
Bought by
Wright Judy A
Current Estimated Value
Home Financials for this Owner
Home Financials are based on the most recent Mortgage that was taken out on this home.
Original Mortgage
$133,185
Outstanding Balance
$116,898
Interest Rate
3.7%
Mortgage Type
New Conventional
Estimated Equity
$239,392
Purchase Details
Closed on
Jan 23, 2013
Sold by
Nielsen Becky and Nielsen Becky Lee
Bought by
Nielsen Becky Lee
Create a Home Valuation Report for This Property
The Home Valuation Report is an in-depth analysis detailing your home's value as well as a comparison with similar homes in the area
Home Values in the Area
Average Home Value in this Area
Purchase History
| Date | Buyer | Sale Price | Title Company |
|---|---|---|---|
| Wright Judy A | -- | Cache Title Logan | |
| Nielsen Becky Lee | -- | None Available |
Source: Public Records
Mortgage History
| Date | Status | Borrower | Loan Amount |
|---|---|---|---|
| Open | Wright Judy A | $133,185 |
Source: Public Records
Tax History
| Year | Tax Paid | Tax Assessment Tax Assessment Total Assessment is a certain percentage of the fair market value that is determined by local assessors to be the total taxable value of land and additions on the property. | Land | Improvement |
|---|---|---|---|---|
| 2025 | $1,505 | $194,625 | $0 | $0 |
| 2024 | $1,554 | $194,625 | $0 | $0 |
| 2023 | $1,621 | $193,505 | $0 | $0 |
| 2022 | $1,736 | $193,505 | $0 | $0 |
| 2021 | $1,379 | $237,480 | $45,000 | $192,480 |
| 2020 | $1,325 | $205,400 | $45,000 | $160,400 |
| 2019 | $1,057 | $156,807 | $45,000 | $111,807 |
| 2018 | $1,032 | $139,752 | $45,000 | $94,752 |
| 2017 | $996 | $71,280 | $0 | $0 |
| 2016 | $1,032 | $66,880 | $0 | $0 |
| 2015 | $969 | $66,880 | $0 | $0 |
| 2014 | $809 | $61,705 | $0 | $0 |
| 2013 | -- | $61,705 | $0 | $0 |
Source: Public Records
Map
Nearby Homes
Your Personal Tour Guide
Ask me questions while you tour the home.