Estimated Value: $522,000 - $786,000
4
Beds
4
Baths
3,069
Sq Ft
$213/Sq Ft
Est. Value
About This Home
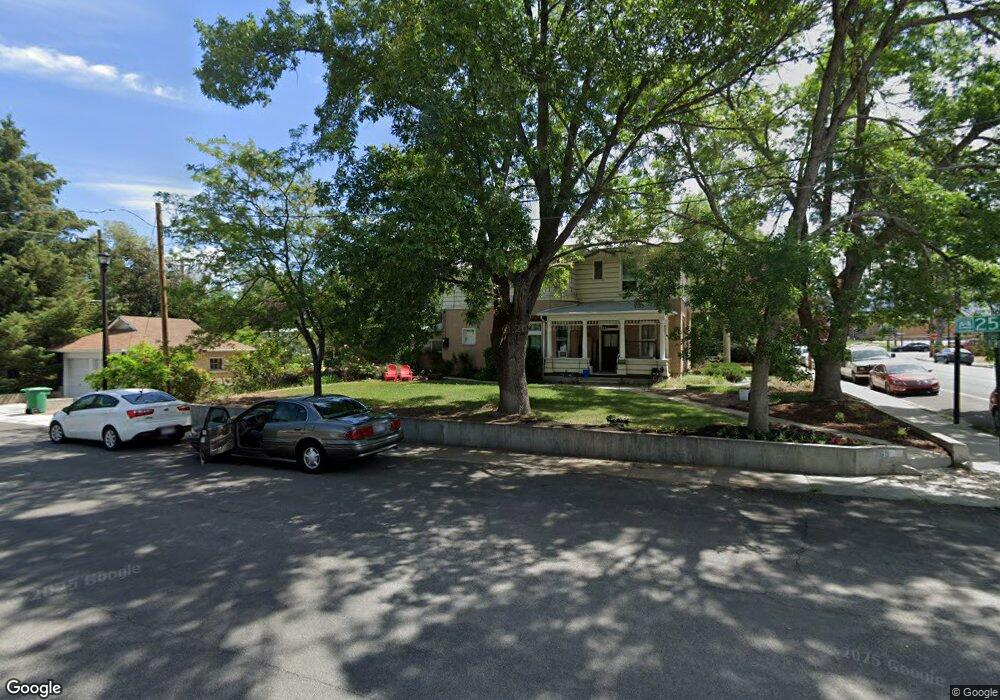
This home is located at 265 E Main St, Sandy, UT 84070 and is currently estimated at $652,984, approximately $212 per square foot. 265 E Main St is a home located in Salt Lake County with nearby schools including Sandy Elementary School, Mount Jordan Middle School, and Jordan High.
Ownership History
Date
Name
Owned For
Owner Type
Purchase Details
Closed on
Apr 16, 2019
Sold by
Olsen Teresa Ann and Landis Teresa Ann
Bought by
Olsen Randy
Current Estimated Value
Home Financials for this Owner
Home Financials are based on the most recent Mortgage that was taken out on this home.
Original Mortgage
$301,953
Outstanding Balance
$263,835
Interest Rate
4.3%
Mortgage Type
Purchase Money Mortgage
Estimated Equity
$389,149
Purchase Details
Closed on
Feb 20, 2015
Sold by
Olsen Randy and Olsen Teresa
Bought by
Olsen Randy
Purchase Details
Closed on
Apr 16, 2002
Sold by
Olsen Randy and Bird Peggy
Bought by
Olsen Randy and Olsen Teresa
Home Financials for this Owner
Home Financials are based on the most recent Mortgage that was taken out on this home.
Original Mortgage
$176,000
Interest Rate
8.75%
Purchase Details
Closed on
Apr 3, 1997
Sold by
Olsen Janet S
Bought by
Olsen Randy
Purchase Details
Closed on
Aug 18, 1976
Sold by
Sjoblom Theodore W and Sjoblom Atha B
Bought by
Olsen Janet S and Bird Peggy
Create a Home Valuation Report for This Property
The Home Valuation Report is an in-depth analysis detailing your home's value as well as a comparison with similar homes in the area
Home Values in the Area
Average Home Value in this Area
Purchase History
| Date | Buyer | Sale Price | Title Company |
|---|---|---|---|
| Olsen Randy | -- | Meridian Title | |
| Olsen Randy | -- | None Available | |
| Olsen Randy | -- | Meridian Title | |
| Olsen Randy | -- | -- | |
| Olsen Janet S | -- | -- |
Source: Public Records
Mortgage History
| Date | Status | Borrower | Loan Amount |
|---|---|---|---|
| Open | Olsen Randy | $301,953 | |
| Closed | Olsen Randy | $176,000 | |
| Closed | Olsen Randy | $44,000 |
Source: Public Records
Tax History
| Year | Tax Paid | Tax Assessment Tax Assessment Total Assessment is a certain percentage of the fair market value that is determined by local assessors to be the total taxable value of land and additions on the property. | Land | Improvement |
|---|---|---|---|---|
| 2025 | $3,377 | $716,100 | $184,300 | $531,800 |
| 2024 | $3,377 | $624,600 | $169,100 | $455,500 |
| 2023 | $3,086 | $569,100 | $160,700 | $408,400 |
| 2022 | $3,294 | $593,300 | $157,600 | $435,700 |
| 2021 | $3,230 | $495,300 | $123,300 | $372,000 |
| 2020 | $3,126 | $452,000 | $123,300 | $328,700 |
| 2019 | $2,814 | $396,500 | $123,300 | $273,200 |
| 2018 | $2,497 | $366,300 | $95,900 | $270,400 |
| 2017 | $2,518 | $352,900 | $88,800 | $264,100 |
| 2016 | $2,500 | $338,700 | $88,800 | $249,900 |
| 2015 | $2,723 | $341,400 | $90,600 | $250,800 |
| 2014 | $2,324 | $285,600 | $87,900 | $197,700 |
Source: Public Records
Map
Nearby Homes
- 270 E 8680 S
- 8558 S Center St
- 112 E 8680 S
- 412 E 8760 S
- 220 E Pioneer Ave
- 194 Pioneer Ave
- 149 E Pioneer Ave
- 227 E St Germain Way
- 8459 S 300 E
- 87 Pioneer Ave
- 8470 Solar Way
- 359 E 8400 S
- 8732 S 620 E
- 627 E 8680 S
- 87 W 8710 S
- 362 E 9150 S
- 635 Pioneer Ave
- 144 E Chambord Ct
- 140 E Chambord Ct
- 132 E Chambord Ct
Your Personal Tour Guide
Ask me questions while you tour the home.