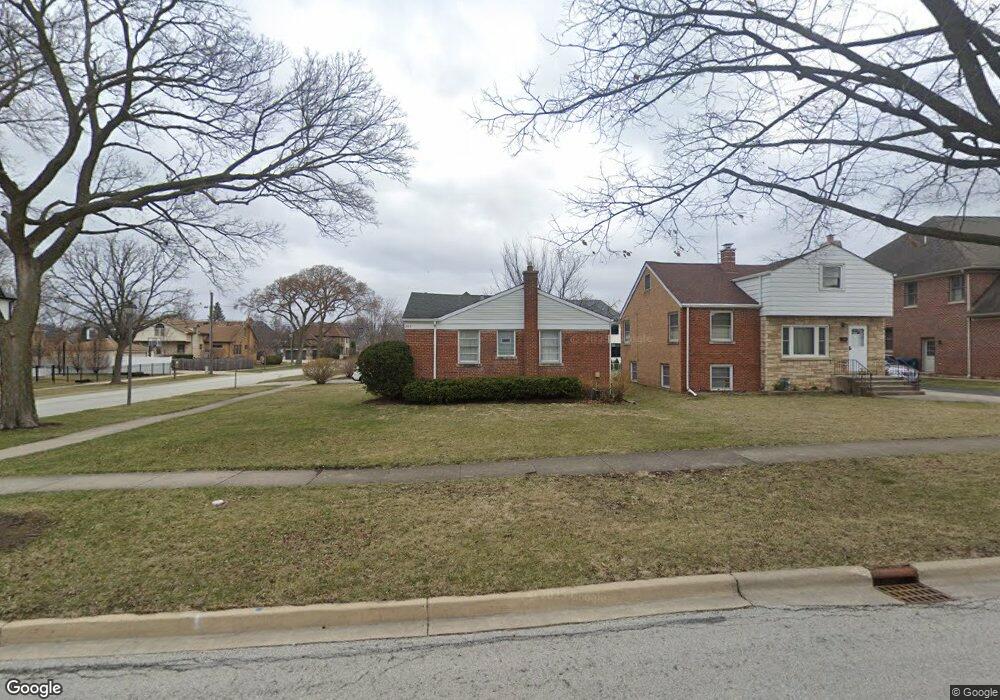
265 E Oneida Ave Elmhurst, IL 60126
Estimated Value: $549,000 - $759,000
3
Beds
2
Baths
1,241
Sq Ft
$536/Sq Ft
Est. Value
About This Home
This home is located at 265 E Oneida Ave, Elmhurst, IL 60126 and is currently estimated at $664,947, approximately $535 per square foot. 265 E Oneida Ave is a home located in DuPage County with nearby schools including Jefferson Elementary School, Bryan Middle School, and York Community High School.
Ownership History
Date
Name
Owned For
Owner Type
Purchase Details
Closed on
Mar 23, 2021
Sold by
Ferguson Edward A and Ferguson Nhoc San
Bought by
Ferguson Edward A and Ferguson Nhoc San
Current Estimated Value
Purchase Details
Closed on
Jan 14, 2010
Sold by
Chong Ferguson Edward and Chong Nhoc San
Bought by
Chong Ferguson Iii Edward A and Chong Nhoc San
Purchase Details
Closed on
Mar 30, 2009
Sold by
Livi Hansen Kathleen A and Livi Elberta M Cemes Revocable
Bought by
Ferguson Edward
Home Financials for this Owner
Home Financials are based on the most recent Mortgage that was taken out on this home.
Original Mortgage
$248,417
Outstanding Balance
$158,467
Interest Rate
5.11%
Mortgage Type
FHA
Estimated Equity
$506,480
Purchase Details
Closed on
Nov 29, 1999
Sold by
Cemes Elberta M
Bought by
Livi Cemes Elberta M and Elberta M Cemes Revocable Living Trust
Create a Home Valuation Report for This Property
The Home Valuation Report is an in-depth analysis detailing your home's value as well as a comparison with similar homes in the area
Home Values in the Area
Average Home Value in this Area
Purchase History
| Date | Buyer | Sale Price | Title Company |
|---|---|---|---|
| Ferguson Edward A | -- | Attorney | |
| Chong Ferguson Iii Edward A | -- | None Available | |
| Ferguson Edward | $253,000 | Atg | |
| Livi Cemes Elberta M | -- | -- |
Source: Public Records
Mortgage History
| Date | Status | Borrower | Loan Amount |
|---|---|---|---|
| Open | Ferguson Edward | $248,417 |
Source: Public Records
Tax History
| Year | Tax Paid | Tax Assessment Tax Assessment Total Assessment is a certain percentage of the fair market value that is determined by local assessors to be the total taxable value of land and additions on the property. | Land | Improvement |
|---|---|---|---|---|
| 2024 | -- | $125,281 | $102,171 | $23,110 |
| 2023 | $6,244 | $115,850 | $94,480 | $21,370 |
| 2022 | $6,597 | $119,790 | $90,830 | $28,960 |
| 2021 | $6,423 | $116,810 | $88,570 | $28,240 |
| 2020 | $6,165 | $114,250 | $86,630 | $27,620 |
| 2019 | $6,321 | $108,620 | $82,360 | $26,260 |
| 2018 | $6,139 | $105,090 | $77,960 | $27,130 |
| 2017 | $5,998 | $100,140 | $74,290 | $25,850 |
| 2016 | $6,812 | $108,620 | $69,990 | $38,630 |
| 2015 | $6,383 | $101,190 | $65,200 | $35,990 |
| 2014 | $4,625 | $71,010 | $51,740 | $19,270 |
| 2013 | $4,958 | $72,010 | $52,470 | $19,540 |
Source: Public Records
Map
Nearby Homes
- 274 E Crescent Ave
- 788 S Cambridge Ave
- 160 E Cayuga Ave
- 837 S Kearsage Ave
- 580 S Kearsage Ave
- 566 S Cedar Ave
- 323 E Butterfield Rd
- 918 S Cambridge Ave
- 857 S Euclid Ave
- 101 W Jackson St
- 251 E South St
- 593 S Edgewood Ave
- 680 S Bryan St
- 522 E Park Manor Ct
- 224 E May St
- 515 S Parkview Ave
- 500 S Kenilworth Ave
- 881 S Bryan St
- 769 S Prospect Ave
- 696 S Prospect Ave
- 269 E Oneida Ave
- 253 E Oneida Ave
- 273 E Oneida Ave
- 707 S Chatham Ave
- 266 E Wilson St
- 249 E Oneida Ave
- 252 E Wilson St
- 277 E Oneida Ave
- 262 E Oneida Ave
- 274 E Oneida Ave
- 245 E Oneida Ave
- 278 E Wilson St
- 276 E Oneida Ave
- 254 E Oneida Ave
- 281 E Oneida Ave
- 246 E Wilson St
- 278 E Oneida Ave
- 246 E Oneida Ave
- 282 E Wilson St
- 242 E Wilson St
Your Personal Tour Guide
Ask me questions while you tour the home.