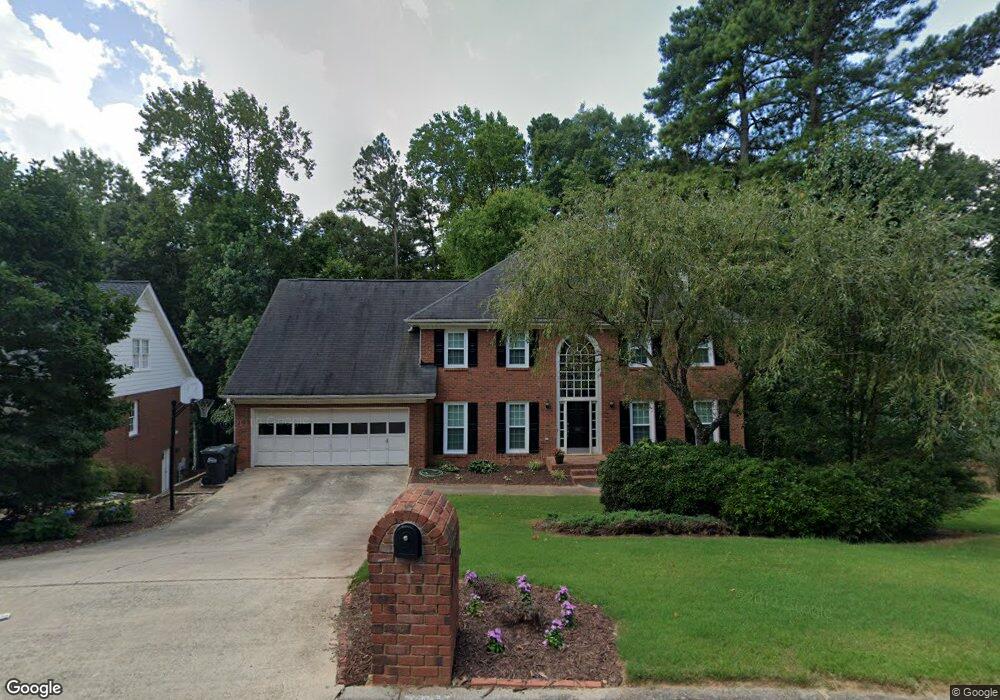
265 Gatsby Place Alpharetta, GA 30022
Newtown NeighborhoodEstimated Value: $667,622 - $826,000
4
Beds
3
Baths
3,170
Sq Ft
$224/Sq Ft
Est. Value
About This Home
This home is located at 265 Gatsby Place, Alpharetta, GA 30022 and is currently estimated at $711,656, approximately $224 per square foot. 265 Gatsby Place is a home located in Fulton County with nearby schools including Hillside Elementary School, Haynes Bridge Middle School, and Centennial High School.
Ownership History
Date
Name
Owned For
Owner Type
Purchase Details
Closed on
Aug 25, 2005
Sold by
Dagesse Jodie R
Bought by
Randel Lisa
Current Estimated Value
Home Financials for this Owner
Home Financials are based on the most recent Mortgage that was taken out on this home.
Original Mortgage
$262,000
Outstanding Balance
$140,259
Interest Rate
5.86%
Mortgage Type
New Conventional
Estimated Equity
$571,397
Purchase Details
Closed on
Apr 25, 2003
Sold by
Dagesse Gary P
Bought by
Dagesse Jodie R
Home Financials for this Owner
Home Financials are based on the most recent Mortgage that was taken out on this home.
Original Mortgage
$187,500
Interest Rate
4.87%
Mortgage Type
Unknown
Purchase Details
Closed on
Aug 16, 1996
Sold by
Truex Theodore Linda
Bought by
Dagesse Gary Jodie
Create a Home Valuation Report for This Property
The Home Valuation Report is an in-depth analysis detailing your home's value as well as a comparison with similar homes in the area
Home Values in the Area
Average Home Value in this Area
Purchase History
| Date | Buyer | Sale Price | Title Company |
|---|---|---|---|
| Randel Lisa | $340,000 | -- | |
| Dagesse Jodie R | -- | -- | |
| Dagesse Gary Jodie | $211,000 | -- |
Source: Public Records
Mortgage History
| Date | Status | Borrower | Loan Amount |
|---|---|---|---|
| Open | Randel Lisa | $262,000 | |
| Previous Owner | Dagesse Jodie R | $187,500 | |
| Closed | Dagesse Gary Jodie | $0 |
Source: Public Records
Tax History Compared to Growth
Tax History
| Year | Tax Paid | Tax Assessment Tax Assessment Total Assessment is a certain percentage of the fair market value that is determined by local assessors to be the total taxable value of land and additions on the property. | Land | Improvement |
|---|---|---|---|---|
| 2025 | $4,116 | $188,200 | $58,880 | $129,320 |
| 2023 | $5,672 | $200,960 | $47,120 | $153,840 |
| 2022 | $3,949 | $181,080 | $39,840 | $141,240 |
| 2021 | $3,920 | $170,840 | $29,560 | $141,280 |
| 2020 | $3,941 | $153,600 | $33,360 | $120,240 |
| 2019 | $465 | $156,640 | $32,320 | $124,320 |
| 2018 | $4,166 | $142,320 | $50,840 | $91,480 |
| 2017 | $3,786 | $123,400 | $44,640 | $78,760 |
| 2016 | $3,723 | $123,400 | $44,640 | $78,760 |
| 2015 | $3,764 | $123,400 | $44,640 | $78,760 |
| 2014 | $3,666 | $117,000 | $25,120 | $91,880 |
Source: Public Records
Map
Nearby Homes
- 2935 Georgian Manor Dr
- 125 Georgian Manor Ct
- 280 Vidaulan Ct
- 160 Arden Place
- 9320 Brumbelow Crossing Way
- 835 Kings Arms Way
- 9165 Nesbit Ferry Rd Unit 9
- 2765 Chandon Place
- 51 Nesbit Place
- 215 Ridge Point Ct
- 2003 Falcon Glen Ct
- 9155 Nesbit Ferry Rd Unit 57
- 140 Old Sandhurst Landing
- 205 Nesbit Entry Dr
- 9024 Tuckerbrook Ln
- 10 Regency Rd
- 275 Gatsby Place
- 275 Gatsby Place
- 255 Gatsby Place Unit 1
- 260 Gatsby Place
- 245 Gatsby Place
- 285 Gatsby Place
- 250 Gatsby Place
- 250 Gatsby Place Unit 1
- 270 Gatsby Place
- 295 Gatsby Place
- 235 Gatsby Place
- 2875 Arborwoods Dr
- 0 Gatsby Place Unit 7526911
- 0 Gatsby Place Unit 3202522
- 0 Gatsby Place Unit 8315112
- 0 Gatsby Place Unit 8003067
- 0 Gatsby Place
- 240 Gatsby Place
- 2895 Arborwoods Dr
- 280 Gatsby Place Unit 1