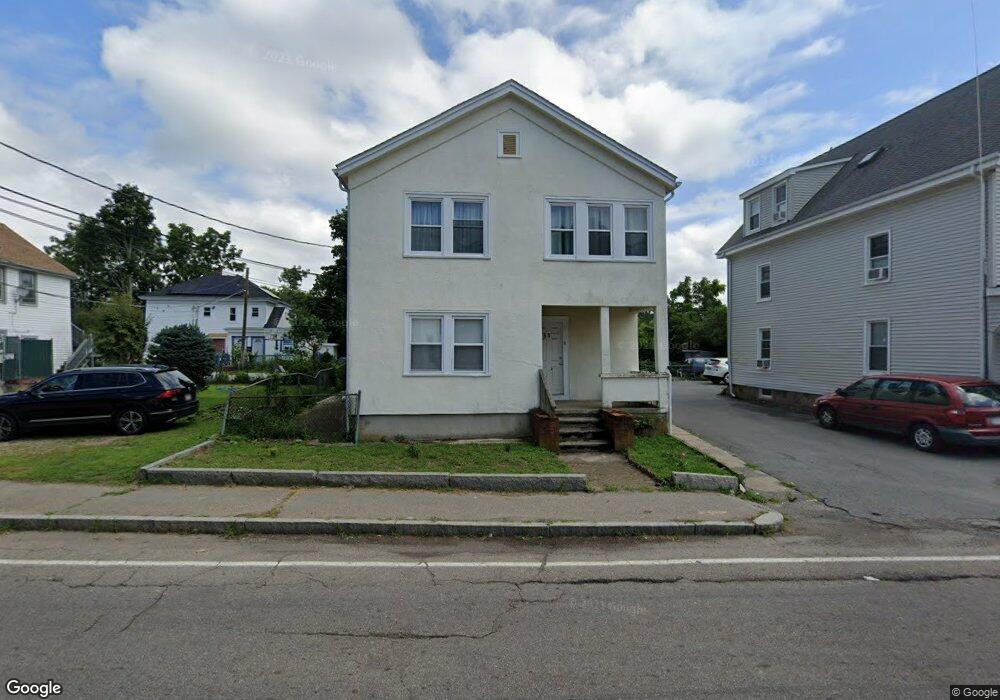
265 Grove St Unit 1 Brockton, MA 02302
Estimated Value: $593,509 - $694,000
3
Beds
1
Bath
1,078
Sq Ft
$604/Sq Ft
Est. Value
About This Home
This home is located at 265 Grove St Unit 1, Brockton, MA 02302 and is currently estimated at $651,377, approximately $604 per square foot. 265 Grove St Unit 1 is a home located in Plymouth County with nearby schools including Brookfield Elementary School, Downey Elementary School, and Mary E. Baker Elementary School.
Ownership History
Date
Name
Owned For
Owner Type
Purchase Details
Closed on
Mar 4, 2022
Sold by
Silva Edson
Bought by
265 Grove St Llc
Current Estimated Value
Purchase Details
Closed on
Mar 21, 2007
Sold by
Pires Luis H
Bought by
Silva Edson
Home Financials for this Owner
Home Financials are based on the most recent Mortgage that was taken out on this home.
Original Mortgage
$312,500
Interest Rate
6.33%
Mortgage Type
Purchase Money Mortgage
Purchase Details
Closed on
Jul 24, 2003
Sold by
Teixeira Antonio B and Teixeira Antero
Bought by
Pires Luis H
Purchase Details
Closed on
Jan 21, 2000
Sold by
Delusiis Dennis D and Deluliis Gael A
Bought by
Teixeira Antonio B and Teixeira Antero
Purchase Details
Closed on
Dec 17, 1987
Sold by
Deiuliis Peter G
Bought by
Deiuliis Dennis D
Create a Home Valuation Report for This Property
The Home Valuation Report is an in-depth analysis detailing your home's value as well as a comparison with similar homes in the area
Home Values in the Area
Average Home Value in this Area
Purchase History
| Date | Buyer | Sale Price | Title Company |
|---|---|---|---|
| 265 Grove St Llc | -- | None Available | |
| Silva Edson | $320,000 | -- | |
| Pires Luis H | $260,000 | -- | |
| Teixeira Antonio B | $127,900 | -- | |
| Deiuliis Dennis D | $65,000 | -- |
Source: Public Records
Mortgage History
| Date | Status | Borrower | Loan Amount |
|---|---|---|---|
| Previous Owner | Deiuliis Dennis D | $312,500 | |
| Previous Owner | Deiuliis Dennis D | $318,400 |
Source: Public Records
Tax History Compared to Growth
Tax History
| Year | Tax Paid | Tax Assessment Tax Assessment Total Assessment is a certain percentage of the fair market value that is determined by local assessors to be the total taxable value of land and additions on the property. | Land | Improvement |
|---|---|---|---|---|
| 2025 | $6,570 | $542,500 | $138,000 | $404,500 |
| 2024 | $6,062 | $504,300 | $138,000 | $366,300 |
| 2023 | $5,774 | $444,800 | $102,900 | $341,900 |
| 2022 | $6,141 | $439,600 | $93,500 | $346,100 |
| 2021 | $5,678 | $391,600 | $77,400 | $314,200 |
| 2020 | $4,344 | $286,700 | $72,800 | $213,900 |
| 2019 | $4,721 | $303,800 | $70,700 | $233,100 |
| 2018 | $4,291 | $267,200 | $70,700 | $196,500 |
| 2017 | $4,131 | $256,600 | $70,700 | $185,900 |
| 2016 | $4,052 | $233,400 | $68,500 | $164,900 |
| 2015 | $3,547 | $195,400 | $68,500 | $126,900 |
| 2014 | $3,408 | $188,000 | $68,500 | $119,500 |
Source: Public Records
Map
Nearby Homes