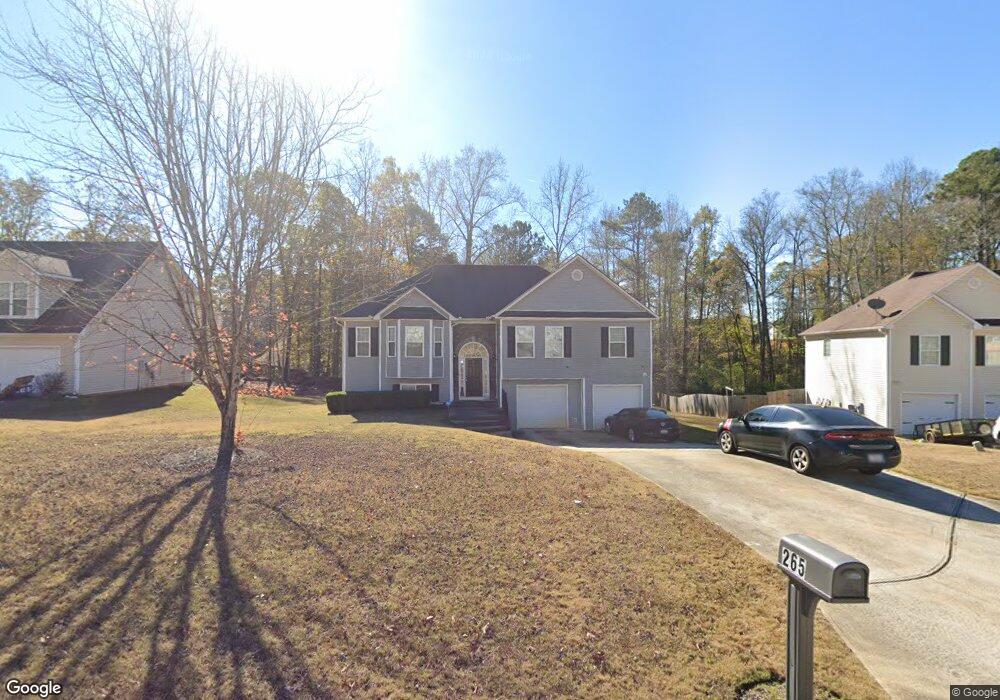
265 Hoglen Dr Covington, GA 30016
Estimated Value: $297,000 - $333,000
6
Beds
3
Baths
1,726
Sq Ft
$184/Sq Ft
Est. Value
About This Home
This home is located at 265 Hoglen Dr, Covington, GA 30016 and is currently estimated at $317,437, approximately $183 per square foot. 265 Hoglen Dr is a home located in Newton County with nearby schools including Newton County Theme School at Ficquett, Clements Middle School, and Newton High School.
Ownership History
Date
Name
Owned For
Owner Type
Purchase Details
Closed on
Feb 27, 2009
Sold by
Fannie Mae
Bought by
Jackson Sharon
Current Estimated Value
Home Financials for this Owner
Home Financials are based on the most recent Mortgage that was taken out on this home.
Original Mortgage
$102,361
Outstanding Balance
$64,281
Interest Rate
5.14%
Mortgage Type
Stand Alone Second
Estimated Equity
$253,156
Purchase Details
Closed on
Oct 7, 2008
Sold by
Freedom Mortgage Corp
Bought by
Federal National Mortgage Association
Purchase Details
Closed on
Apr 13, 2007
Sold by
Jcs Hms Inc
Bought by
Perry Victor E
Home Financials for this Owner
Home Financials are based on the most recent Mortgage that was taken out on this home.
Original Mortgage
$196,900
Interest Rate
6.1%
Mortgage Type
New Conventional
Create a Home Valuation Report for This Property
The Home Valuation Report is an in-depth analysis detailing your home's value as well as a comparison with similar homes in the area
Home Values in the Area
Average Home Value in this Area
Purchase History
| Date | Buyer | Sale Price | Title Company |
|---|---|---|---|
| Jackson Sharon | -- | -- | |
| Federal National Mortgage Association | -- | -- | |
| Freedom Mortgage Corp | $226,420 | -- | |
| Perry Victor E | $196,900 | -- |
Source: Public Records
Mortgage History
| Date | Status | Borrower | Loan Amount |
|---|---|---|---|
| Open | Jackson Sharon | $102,361 | |
| Previous Owner | Perry Victor E | $196,900 |
Source: Public Records
Tax History
| Year | Tax Paid | Tax Assessment Tax Assessment Total Assessment is a certain percentage of the fair market value that is determined by local assessors to be the total taxable value of land and additions on the property. | Land | Improvement |
|---|---|---|---|---|
| 2025 | $3,154 | $130,160 | $18,000 | $112,160 |
| 2024 | $3,095 | $123,400 | $18,000 | $105,400 |
| 2023 | $2,882 | $107,640 | $9,400 | $98,240 |
| 2022 | $2,420 | $90,600 | $9,400 | $81,200 |
| 2021 | $2,376 | $80,040 | $9,400 | $70,640 |
| 2020 | $1,786 | $55,120 | $6,600 | $48,520 |
| 2019 | $1,783 | $54,280 | $6,600 | $47,680 |
| 2018 | $1,707 | $51,720 | $6,600 | $45,120 |
| 2017 | $1,134 | $35,040 | $6,600 | $28,440 |
| 2016 | $1,134 | $35,040 | $6,600 | $28,440 |
| 2015 | $1,170 | $36,120 | $6,600 | $29,520 |
| 2014 | $1,140 | $35,280 | $0 | $0 |
Source: Public Records
Map
Nearby Homes
- 275 Hoglen Dr
- 275 Greenfield Way
- 65 Montgomery Ct Unit 1
- 65 Rosewood Cir
- 170 Queensland Ln
- 170 Camerons Way
- 200 Syracuse Ln
- 40 Princeton Ct
- 105 Queensland Ln
- 130 Camerons Way
- 100 Arlington Dr Unit 2
- 35 Rolling Ridge Dr
- 40 Bermuda Cir
- 90 Beaver Run Rd
- 50 Evelyn Rd
- 1040 Kirkland Rd
- 3004 Fairview Rd
- 30 Silver Peak Dr
- 415 Piedmont Cir
- 445 Piedmont Cir
- 255 Hoglen Dr
- 245 Hoglen Dr
- 285 Hoglen Dr
- 240 Landon Way Unit 28
- 240 Landon Way
- 235 Hoglen Dr
- 250 Landon Way
- 290 Hoglen Dr
- 260 Hoglen Dr
- 250 Hoglen Dr
- 230 Landon Way
- 225 Hoglen Dr
- 255 Landon Way
- 240 Hoglen Dr
- 245 Landon Way
- 95 Green Gables Dr Unit 3
- 230 Hoglen Dr
- 220 Landon Way
- 220 Landon Way Unit N/
Your Personal Tour Guide
Ask me questions while you tour the home.