Estimated Value: $533,701 - $636,000
2
Beds
1
Bath
1,270
Sq Ft
$452/Sq Ft
Est. Value
About This Home
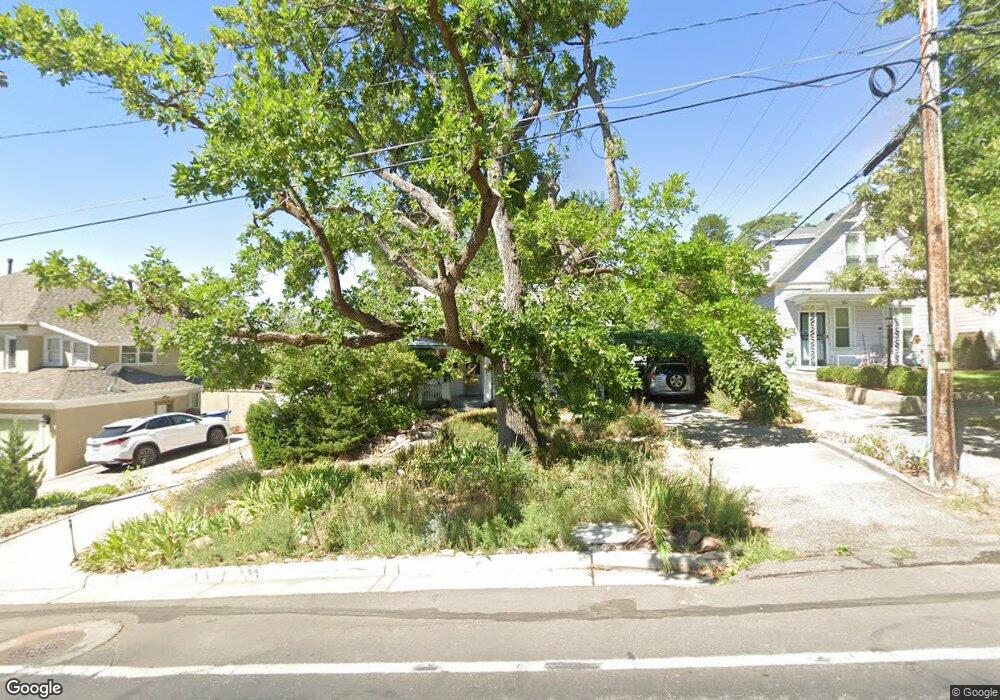
This home is located at 265 I St, Salt Lake City, UT 84103 and is currently estimated at $574,175, approximately $452 per square foot. 265 I St is a home located in Salt Lake County with nearby schools including Ensign School, West High, and Open Classroom.
Ownership History
Date
Name
Owned For
Owner Type
Purchase Details
Closed on
Feb 13, 2025
Sold by
Jacobson Gary A
Bought by
Gary A Jacobson Revocable Trust and Jacobson
Current Estimated Value
Purchase Details
Closed on
Oct 2, 2020
Sold by
Jacobson Gary A
Bought by
Jacobson Gary A
Home Financials for this Owner
Home Financials are based on the most recent Mortgage that was taken out on this home.
Original Mortgage
$254,000
Interest Rate
2.9%
Mortgage Type
New Conventional
Purchase Details
Closed on
Jul 19, 2017
Sold by
Williams Jimmie Lee
Bought by
Jacobson Gary A
Home Financials for this Owner
Home Financials are based on the most recent Mortgage that was taken out on this home.
Original Mortgage
$263,920
Interest Rate
3.89%
Mortgage Type
New Conventional
Purchase Details
Closed on
Nov 1, 1993
Sold by
Williams Marilyn Sue
Bought by
Williams Jimmie Lee
Create a Home Valuation Report for This Property
The Home Valuation Report is an in-depth analysis detailing your home's value as well as a comparison with similar homes in the area
Home Values in the Area
Average Home Value in this Area
Purchase History
| Date | Buyer | Sale Price | Title Company |
|---|---|---|---|
| Gary A Jacobson Revocable Trust | -- | None Listed On Document | |
| Gary A Jacobson Revocable Trust | -- | None Listed On Document | |
| Jacobson Gary A | -- | North American Title Llc | |
| Jacobson Gary A | -- | Sutherland Title | |
| Williams Jimmie Lee | -- | United Title Services |
Source: Public Records
Mortgage History
| Date | Status | Borrower | Loan Amount |
|---|---|---|---|
| Previous Owner | Jacobson Gary A | $254,000 | |
| Previous Owner | Jacobson Gary A | $263,920 |
Source: Public Records
Tax History Compared to Growth
Tax History
| Year | Tax Paid | Tax Assessment Tax Assessment Total Assessment is a certain percentage of the fair market value that is determined by local assessors to be the total taxable value of land and additions on the property. | Land | Improvement |
|---|---|---|---|---|
| 2025 | $2,567 | $517,400 | $147,900 | $369,500 |
| 2024 | $2,567 | $489,800 | $141,100 | $348,700 |
| 2023 | $2,567 | $473,900 | $135,700 | $338,200 |
| 2022 | $2,394 | $413,100 | $133,100 | $280,000 |
| 2021 | $2,304 | $359,900 | $108,200 | $251,700 |
| 2020 | $2,261 | $336,200 | $102,800 | $233,400 |
| 2019 | $2,337 | $327,000 | $96,300 | $230,700 |
| 2018 | $2,294 | $312,500 | $96,300 | $216,200 |
| 2017 | $648 | $233,900 | $96,300 | $137,600 |
| 2016 | $1,816 | $213,100 | $92,000 | $121,100 |
| 2015 | $1,816 | $208,600 | $87,000 | $121,600 |
| 2014 | -- | $196,300 | $83,500 | $112,800 |
Source: Public Records
Map
Nearby Homes