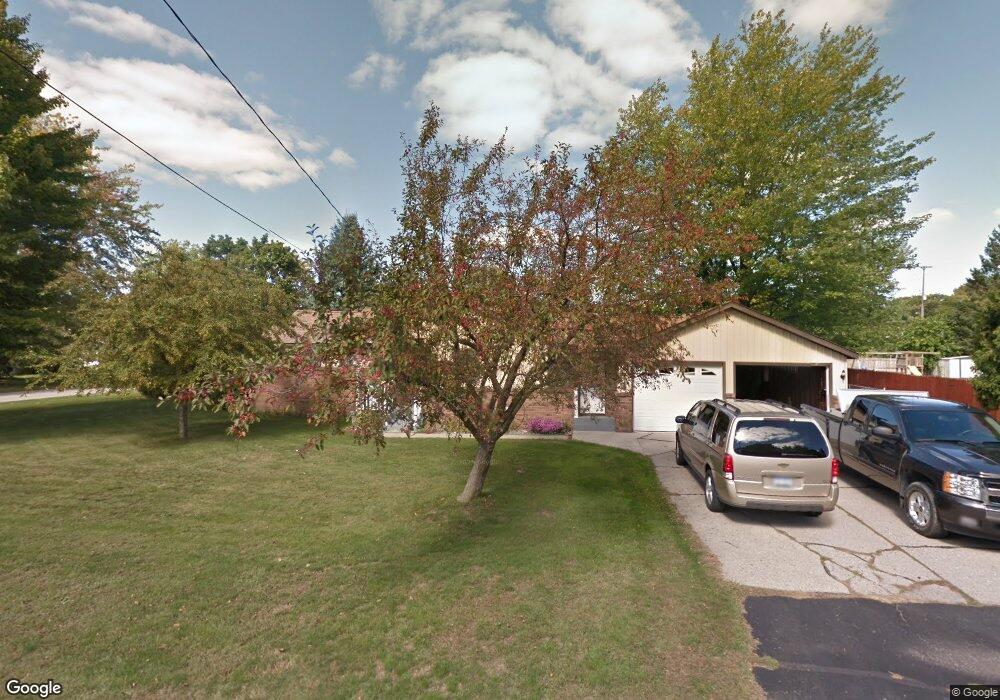
265 Jeffery St Cedar Springs, MI 49319
Estimated Value: $227,000 - $243,000
3
Beds
2
Baths
1,311
Sq Ft
$180/Sq Ft
Est. Value
About This Home
This home is located at 265 Jeffery St, Cedar Springs, MI 49319 and is currently estimated at $236,515, approximately $180 per square foot. 265 Jeffery St is a home located in Kent County with nearby schools including Cedar Trails Elementary School, Red Hawk Intermediate School, and Beach Elementary School.
Ownership History
Date
Name
Owned For
Owner Type
Purchase Details
Closed on
Sep 23, 2025
Sold by
Matthews Daisy
Bought by
Garza Abigail
Current Estimated Value
Home Financials for this Owner
Home Financials are based on the most recent Mortgage that was taken out on this home.
Original Mortgage
$182,000
Outstanding Balance
$182,000
Interest Rate
6.58%
Mortgage Type
New Conventional
Estimated Equity
$54,515
Purchase Details
Closed on
Sep 30, 2022
Sold by
Roe Ryan
Bought by
Matthews Daisy
Home Financials for this Owner
Home Financials are based on the most recent Mortgage that was taken out on this home.
Original Mortgage
$200,050
Interest Rate
5.13%
Mortgage Type
Construction
Purchase Details
Closed on
Aug 6, 2021
Sold by
Wesche Beverly E
Bought by
Roe Ryan
Home Financials for this Owner
Home Financials are based on the most recent Mortgage that was taken out on this home.
Original Mortgage
$174,240
Interest Rate
2.9%
Mortgage Type
New Conventional
Purchase Details
Closed on
May 12, 2015
Sold by
Wesche Phillip A and Wesche Beverly E
Bought by
Wesche Phillip A and Wesche Beverly E
Create a Home Valuation Report for This Property
The Home Valuation Report is an in-depth analysis detailing your home's value as well as a comparison with similar homes in the area
Home Values in the Area
Average Home Value in this Area
Purchase History
| Date | Buyer | Sale Price | Title Company |
|---|---|---|---|
| Garza Abigail | $243,001 | Lighthouse Title Agency | |
| Garza Abigail | $243,001 | Lighthouse Title Agency | |
| Matthews Daisy | $194,000 | -- | |
| Matthews Daisy | $194,000 | -- | |
| Roe Ryan | $176,000 | Ata National Title Group Llc | |
| Roe Ryan | $176,000 | Ata National Title Group Llc | |
| Wesche Phillip A | -- | None Available | |
| Wesche Phillip A | -- | None Available |
Source: Public Records
Mortgage History
| Date | Status | Borrower | Loan Amount |
|---|---|---|---|
| Open | Garza Abigail | $182,000 | |
| Previous Owner | Matthews Daisy | $200,050 | |
| Previous Owner | Roe Ryan | $174,240 |
Source: Public Records
Tax History Compared to Growth
Tax History
| Year | Tax Paid | Tax Assessment Tax Assessment Total Assessment is a certain percentage of the fair market value that is determined by local assessors to be the total taxable value of land and additions on the property. | Land | Improvement |
|---|---|---|---|---|
| 2025 | $4,147 | $117,800 | $0 | $0 |
| 2024 | $4,147 | $102,300 | $0 | $0 |
| 2023 | $5,556 | $91,400 | $0 | $0 |
| 2022 | $3,734 | $81,400 | $0 | $0 |
| 2021 | $2,294 | $74,600 | $0 | $0 |
| 2020 | $2,174 | $66,300 | $0 | $0 |
| 2019 | $2,111 | $64,100 | $0 | $0 |
| 2018 | $2,066 | $62,300 | $0 | $0 |
| 2017 | $2,009 | $59,100 | $0 | $0 |
| 2016 | $1,951 | $50,900 | $0 | $0 |
| 2015 | -- | $50,900 | $0 | $0 |
| 2013 | -- | $43,800 | $0 | $0 |
Source: Public Records
Map
Nearby Homes
- 322 E Ash St NE
- 17 E Muskegon St
- 179 S 2nd St
- 197 E Elm St
- 226 Cedar St NE
- 5312 18 Mile Rd NE
- 134 N 5th St NE
- 295 8th St NE
- 373 Cedar St NE
- 4398 17 Mile Rd NE
- 364 Prairie Run Dr
- 320 W Pine St NE
- 360 Tall Grass Dr
- 13280 Ritchie Ave NE
- 551 Snow Pine Ct
- 520 Hawk Wood Ct
- 570 Hawk Wood Ct
- 500 Needlewood Dr NE
- 541 Snow Pine Ct
- 540 Hawk Wood Ct