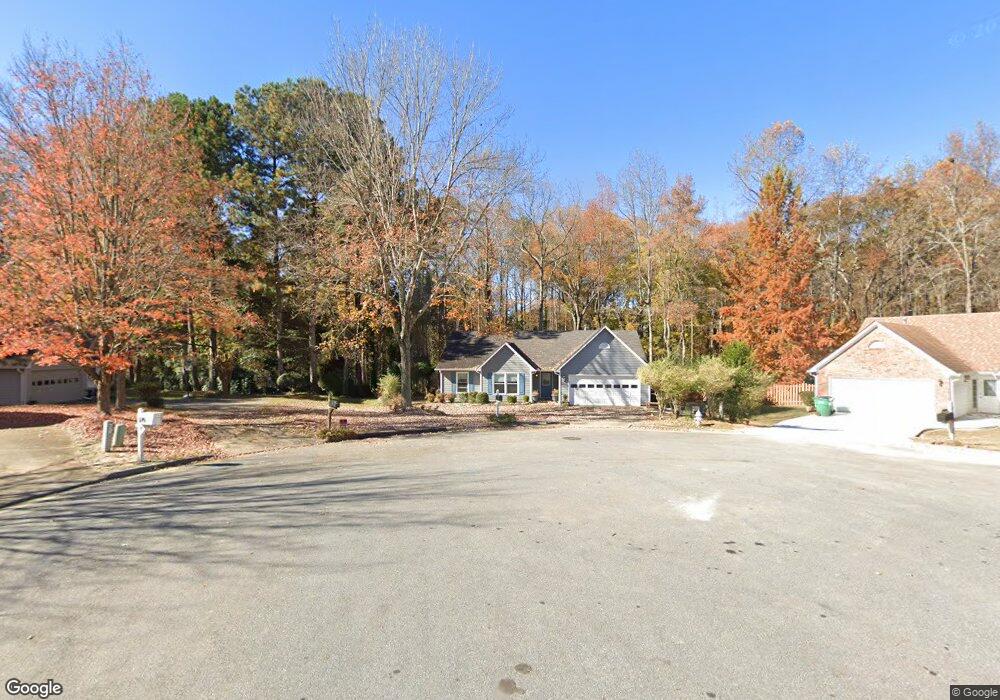
265 Jones Bridge Place Alpharetta, GA 30022
Estimated Value: $502,108 - $539,000
3
Beds
2
Baths
1,603
Sq Ft
$323/Sq Ft
Est. Value
About This Home
This home is located at 265 Jones Bridge Place, Alpharetta, GA 30022 and is currently estimated at $518,527, approximately $323 per square foot. 265 Jones Bridge Place is a home located in Fulton County with nearby schools including Ocee Elementary School, Taylor Road Middle School, and Chattahoochee High School.
Ownership History
Date
Name
Owned For
Owner Type
Purchase Details
Closed on
Aug 20, 2021
Sold by
Song Chang
Bought by
Dileep Avinash Hedge and Sur Sanghamitra
Current Estimated Value
Home Financials for this Owner
Home Financials are based on the most recent Mortgage that was taken out on this home.
Original Mortgage
$312,800
Outstanding Balance
$283,571
Interest Rate
2.7%
Mortgage Type
New Conventional
Estimated Equity
$234,956
Purchase Details
Closed on
Oct 25, 2018
Sold by
An Sang Hyun
Bought by
Song Chang
Purchase Details
Closed on
Aug 28, 2013
Sold by
Thrun Mary J
Bought by
An Sang Hyun and Bae Soon Hui
Home Financials for this Owner
Home Financials are based on the most recent Mortgage that was taken out on this home.
Original Mortgage
$136,500
Interest Rate
4.37%
Mortgage Type
New Conventional
Create a Home Valuation Report for This Property
The Home Valuation Report is an in-depth analysis detailing your home's value as well as a comparison with similar homes in the area
Home Values in the Area
Average Home Value in this Area
Purchase History
| Date | Buyer | Sale Price | Title Company |
|---|---|---|---|
| Dileep Avinash Hedge | $391,000 | -- | |
| Song Chang | $225,000 | -- | |
| An Sang Hyun | $182,000 | -- |
Source: Public Records
Mortgage History
| Date | Status | Borrower | Loan Amount |
|---|---|---|---|
| Open | Dileep Avinash Hedge | $312,800 | |
| Previous Owner | An Sang Hyun | $136,500 |
Source: Public Records
Tax History Compared to Growth
Tax History
| Year | Tax Paid | Tax Assessment Tax Assessment Total Assessment is a certain percentage of the fair market value that is determined by local assessors to be the total taxable value of land and additions on the property. | Land | Improvement |
|---|---|---|---|---|
| 2025 | $4,901 | $224,720 | $52,120 | $172,600 |
| 2023 | $4,489 | $159,040 | $46,320 | $112,720 |
| 2022 | $4,125 | $134,440 | $28,160 | $106,280 |
| 2021 | $2,914 | $108,960 | $27,840 | $81,120 |
| 2020 | $397 | $103,240 | $24,440 | $78,800 |
| 2019 | $35 | $90,000 | $21,760 | $68,240 |
| 2018 | $2,227 | $90,400 | $21,880 | $68,520 |
| 2017 | $1,836 | $69,680 | $14,960 | $54,720 |
| 2016 | $1,791 | $69,680 | $14,960 | $54,720 |
| 2015 | $1,811 | $69,680 | $14,960 | $54,720 |
| 2014 | $1,774 | $66,880 | $14,800 | $52,080 |
Source: Public Records
Map
Nearby Homes
- 4790 Roswell Mill Dr
- 11390 Ridge Hill Dr
- 130 Douglas Fir Ct Unit 1
- 4740 Carversham Way
- 310 Creekside Dr
- 4905 Weathervane Dr
- 690 Kimball Parc Way
- 680 Kimball Parc Way
- 4965 N Bridges Dr
- 485 Portrait Cir
- 4965 Cinnabar Dr
- 134 Wards Crossing Way Unit 17
- 5060 Cinnabar Dr
- 11085 State Bridge Rd
- 5022 Anclote Dr
- 11686 Davenport Ln
- 11619 Davenport Ln
- 5160 Abbotts Bridge Rd
- 4645 Valais Ct Unit 109
- 1620 Silverleaf Way
- 265 Jones Bridge Place Cir
- 255 Jones Bridge Place Cir
- 280 Jones Bridge Place Cir
- 270 Jones Bridge Place Cir
- 245 Jones Bridge Place Cir
- 260 Jones Bridge Place Cir
- 235 Jones Bridge Place Cir
- 130 Seesen Ct
- 120 Seesen Ct Unit 3
- 250 Jones Bridge Place Cir
- 4770 Minden Chase
- 4825 Jones Bridge Place Dr
- 225 Jones Bridge Place Cir
- 4780 Minden Chase Unit 3
- 4760 Minden Chase
- 4760 Minden Chase Unit 4760
- 4750 Minden Chase Unit 3
- 4790 Minden Chase
- 4580 Hampton Square Dr
- 4835 Jones Bridge Place Dr