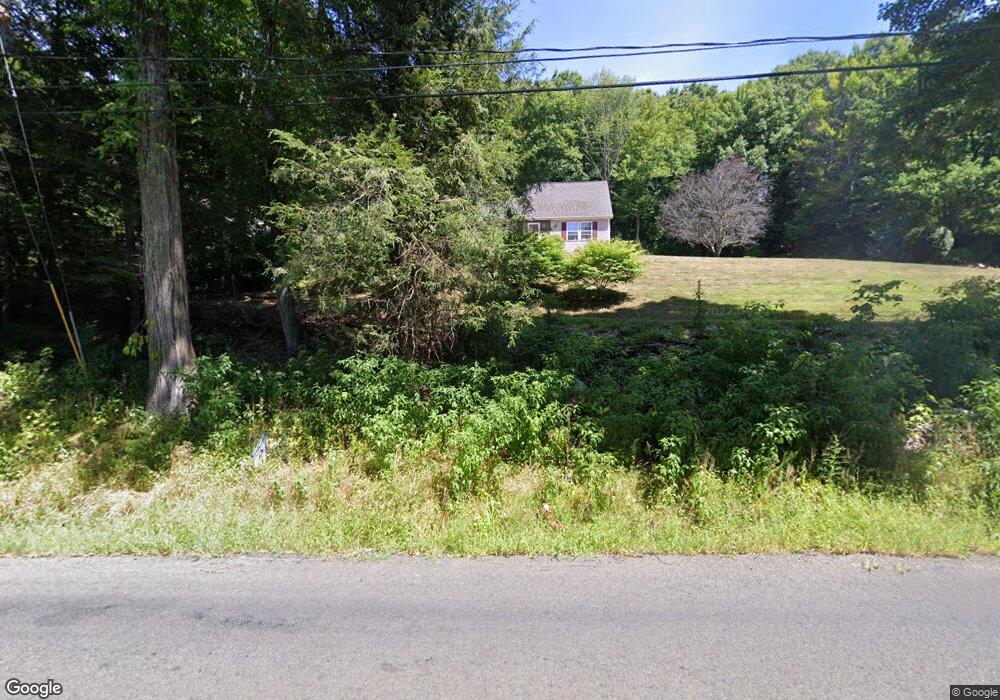
265 Lead Mine Brook Rd Harwinton, CT 06791
Estimated Value: $428,000 - $456,000
3
Beds
3
Baths
1,144
Sq Ft
$385/Sq Ft
Est. Value
About This Home
This home is located at 265 Lead Mine Brook Rd, Harwinton, CT 06791 and is currently estimated at $440,805, approximately $385 per square foot. 265 Lead Mine Brook Rd is a home located in Litchfield County with nearby schools including Harwinton Consolidated School, Har-Bur Middle School, and Lewis S. Mills High School.
Ownership History
Date
Name
Owned For
Owner Type
Purchase Details
Closed on
Aug 17, 2000
Sold by
Armstrong Rodney C and Armstrong Sandra B
Bought by
Fallon David E and Fallon Bridget E
Current Estimated Value
Purchase Details
Closed on
Dec 14, 1995
Sold by
Orefice Michael J and Orefice Cynthia A
Bought by
Armstrong Rodney C and Armstrong Sandra B
Create a Home Valuation Report for This Property
The Home Valuation Report is an in-depth analysis detailing your home's value as well as a comparison with similar homes in the area
Home Values in the Area
Average Home Value in this Area
Purchase History
| Date | Buyer | Sale Price | Title Company |
|---|---|---|---|
| Fallon David E | $32,000 | -- | |
| Fallon David E | $32,000 | -- | |
| Armstrong Rodney C | $32,000 | -- | |
| Armstrong Rodney C | $32,000 | -- |
Source: Public Records
Mortgage History
| Date | Status | Borrower | Loan Amount |
|---|---|---|---|
| Open | Armstrong Rodney C | $146,910 | |
| Closed | Armstrong Rodney C | $157,000 | |
| Closed | Armstrong Rodney C | $31,000 |
Source: Public Records
Tax History Compared to Growth
Tax History
| Year | Tax Paid | Tax Assessment Tax Assessment Total Assessment is a certain percentage of the fair market value that is determined by local assessors to be the total taxable value of land and additions on the property. | Land | Improvement |
|---|---|---|---|---|
| 2025 | $5,848 | $254,250 | $75,730 | $178,520 |
| 2024 | $5,822 | $254,250 | $75,730 | $178,520 |
| 2023 | $5,599 | $191,740 | $54,500 | $137,240 |
| 2022 | $5,465 | $191,740 | $54,500 | $137,240 |
| 2021 | $5,503 | $191,740 | $54,500 | $137,240 |
| 2020 | $5,369 | $191,740 | $54,500 | $137,240 |
| 2019 | $5,369 | $191,740 | $54,500 | $137,240 |
| 2018 | $5,153 | $184,020 | $68,470 | $115,550 |
| 2017 | $5,116 | $184,020 | $68,470 | $115,550 |
| 2016 | $5,116 | $184,020 | $68,470 | $115,550 |
| 2015 | $5,024 | $184,020 | $68,470 | $115,550 |
| 2014 | $4,950 | $184,020 | $68,470 | $115,550 |
Source: Public Records
Map
Nearby Homes
- 73 Shirley Rd
- 51 Bradford Rd
- 74 Pine Ridge Dr
- 164 Birge Park Rd
- 111 Oxbow Dr
- 69 Sunrise Dr
- 144 Morningside Dr
- 410 Circle Dr
- 33 Dawn Ave
- 325 Circle Dr
- 29 Hannah Way
- 141 Highfield Dr
- 157 Edgewood Dr
- 178 Edgewood Dr
- 595 Torringford St
- 0 Torringford St W
- 100 Nutmeg Dr
- 119 Tognalli Dr
- 175 Ramstein Rd
- 165 Birchwood Dr
- 261 Lead Mine Brook Rd
- 260 Lead Mine Brook Rd
- 253 Lead Mine Brook Rd
- 252 Lead Mine Brook Rd
- 241 Lead Mine Brook Rd
- 366 Birge Park Rd
- 231 Lead Mine Brook Rd
- 232 Lead Mine Brook Rd
- 232 Lead Mine Brook Rd Unit C
- 232 Lead Mine Brook Rd Unit D
- 36 Garden Ln Unit C
- 36 Garden Ln
- 35 Garden Ln Unit A
- 35 Garden Ln
- 35 Garden Ln Unit B
- 94 Lake Harwinton Rd
- 111 Woodland Dr
- 117 Woodland Dr
- 76 Woodland Dr
- 122 Woodland Dr