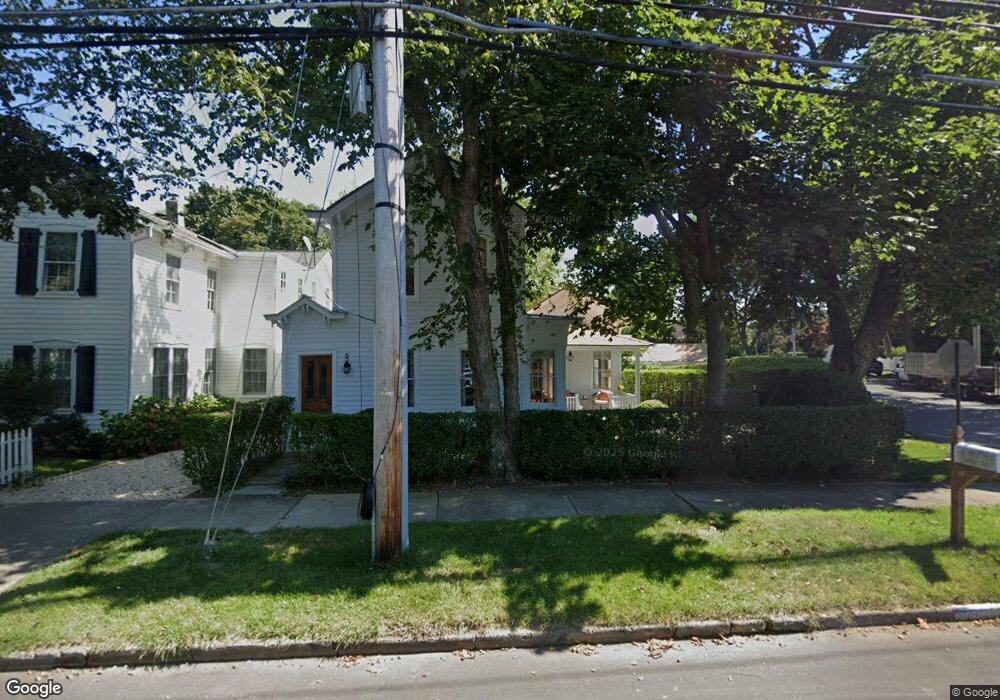
265 Main St Sag Harbor, NY 11963
Estimated Value: $2,569,000 - $4,247,039
3
Beds
2
Baths
1,538
Sq Ft
$2,125/Sq Ft
Est. Value
About This Home
This home is located at 265 Main St, Sag Harbor, NY 11963 and is currently estimated at $3,268,760, approximately $2,125 per square foot. 265 Main St is a home located in Suffolk County with nearby schools including Sag Harbor Elementary School, Pierson Middle/High School, and Ross Lower School.
Ownership History
Date
Name
Owned For
Owner Type
Purchase Details
Closed on
Jun 30, 2015
Sold by
Burke Molly Lukins
Bought by
Silcox Julie
Current Estimated Value
Home Financials for this Owner
Home Financials are based on the most recent Mortgage that was taken out on this home.
Original Mortgage
$1,140,000
Outstanding Balance
$893,539
Interest Rate
4.01%
Mortgage Type
New Conventional
Estimated Equity
$2,375,221
Purchase Details
Closed on
Jul 15, 2010
Sold by
Klebanoff Arthur and Lukins Sheila
Bought by
Burke Molly Lukins
Purchase Details
Closed on
Nov 14, 2000
Sold by
Lawson Thomas L
Bought by
Lukins Sheila
Home Financials for this Owner
Home Financials are based on the most recent Mortgage that was taken out on this home.
Original Mortgage
$344,000
Interest Rate
7.64%
Mortgage Type
Purchase Money Mortgage
Create a Home Valuation Report for This Property
The Home Valuation Report is an in-depth analysis detailing your home's value as well as a comparison with similar homes in the area
Home Values in the Area
Average Home Value in this Area
Purchase History
| Date | Buyer | Sale Price | Title Company |
|---|---|---|---|
| Silcox Julie | $1,425,000 | None Available | |
| Burke Molly Lukins | -- | -- | |
| Lukins Sheila | $430,000 | Fidelity National Title Ins |
Source: Public Records
Mortgage History
| Date | Status | Borrower | Loan Amount |
|---|---|---|---|
| Open | Silcox Julie | $1,140,000 | |
| Previous Owner | Lukins Sheila | $344,000 |
Source: Public Records
Tax History Compared to Growth
Tax History
| Year | Tax Paid | Tax Assessment Tax Assessment Total Assessment is a certain percentage of the fair market value that is determined by local assessors to be the total taxable value of land and additions on the property. | Land | Improvement |
|---|---|---|---|---|
| 2024 | $5,971 | $2,149,600 | $784,100 | $1,365,500 |
| 2023 | $5,912 | $2,149,600 | $784,100 | $1,365,500 |
| 2022 | $5,837 | $2,149,600 | $784,100 | $1,365,500 |
| 2021 | $5,873 | $2,100,000 | $734,500 | $1,365,500 |
| 2020 | $11,192 | $2,149,600 | $784,100 | $1,365,500 |
| 2019 | $16,901 | $0 | $0 | $0 |
| 2018 | -- | $1,897,000 | $784,100 | $1,112,900 |
| 2017 | $7,636 | $1,329,000 | $784,100 | $544,900 |
| 2016 | $7,721 | $1,292,200 | $784,100 | $508,100 |
| 2015 | -- | $958,100 | $784,100 | $174,000 |
| 2014 | -- | $958,100 | $784,100 | $174,000 |
Source: Public Records
Map
Nearby Homes