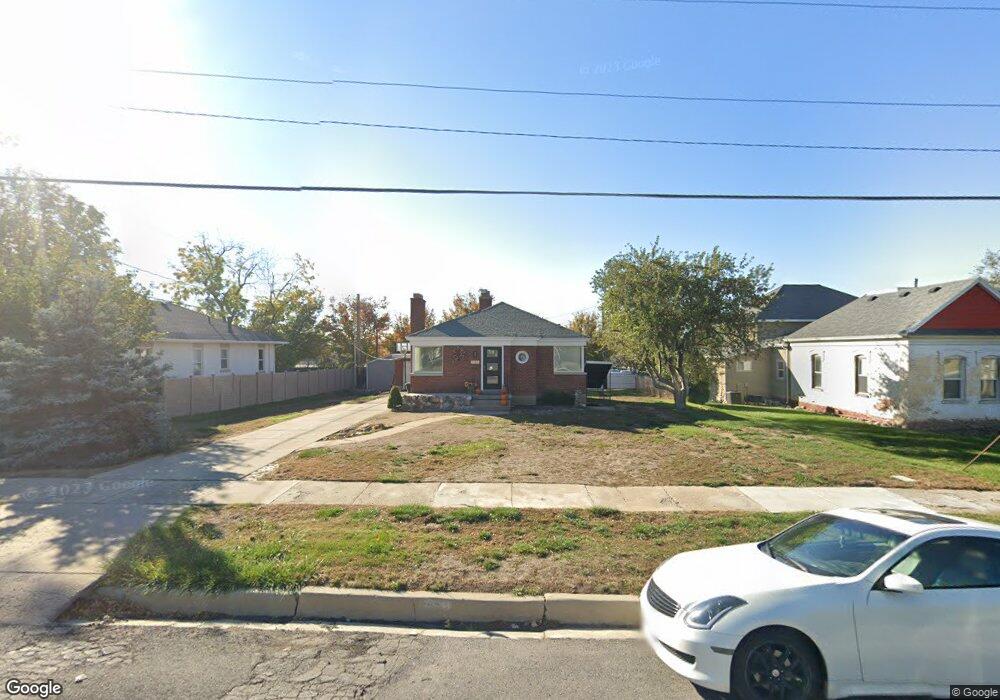
265 N 100 E Bountiful, UT 84010
Estimated Value: $440,000 - $516,000
4
Beds
2
Baths
2,272
Sq Ft
$215/Sq Ft
Est. Value
About This Home
This home is located at 265 N 100 E, Bountiful, UT 84010 and is currently estimated at $488,848, approximately $215 per square foot. 265 N 100 E is a home located in Davis County with nearby schools including Meadowbrook Elementary School, Bountiful Junior High School, and Bountiful High School.
Ownership History
Date
Name
Owned For
Owner Type
Purchase Details
Closed on
Jan 3, 2025
Sold by
Bethers Brooks
Bought by
Bethers Brenda
Current Estimated Value
Home Financials for this Owner
Home Financials are based on the most recent Mortgage that was taken out on this home.
Original Mortgage
$160,000
Outstanding Balance
$158,754
Interest Rate
6.84%
Mortgage Type
New Conventional
Estimated Equity
$330,094
Purchase Details
Closed on
Aug 1, 2014
Sold by
Davis Steven K
Bought by
Bethers Brooks
Home Financials for this Owner
Home Financials are based on the most recent Mortgage that was taken out on this home.
Original Mortgage
$122,625
Interest Rate
4.13%
Mortgage Type
New Conventional
Purchase Details
Closed on
Jul 21, 2011
Sold by
Eggett Irene H
Bought by
Davis Steven K
Create a Home Valuation Report for This Property
The Home Valuation Report is an in-depth analysis detailing your home's value as well as a comparison with similar homes in the area
Purchase History
| Date | Buyer | Sale Price | Title Company |
|---|---|---|---|
| Bethers Brenda | -- | Us Title | |
| Bethers Brooks | -- | Advanced Title Ins | |
| Davis Steven K | -- | Aspen Title Insuranc | |
| Eggett Irene H | -- | Aspen Title Insuranc |
Source: Public Records
Mortgage History
| Date | Status | Borrower | Loan Amount |
|---|---|---|---|
| Open | Bethers Brenda | $160,000 | |
| Previous Owner | Bethers Brooks | $122,625 |
Source: Public Records
Tax History
| Year | Tax Paid | Tax Assessment Tax Assessment Total Assessment is a certain percentage of the fair market value that is determined by local assessors to be the total taxable value of land and additions on the property. | Land | Improvement |
|---|---|---|---|---|
| 2025 | $2,732 | $244,200 | $136,186 | $108,014 |
| 2024 | $2,550 | $237,049 | $122,861 | $114,188 |
| 2023 | $2,453 | $227,700 | $123,736 | $103,963 |
| 2022 | $2,472 | $416,000 | $222,844 | $193,156 |
| 2021 | $2,272 | $322,000 | $160,449 | $161,551 |
| 2020 | $2,010 | $285,000 | $136,556 | $148,444 |
| 2019 | $1,955 | $270,000 | $140,843 | $129,157 |
| 2018 | $1,808 | $245,000 | $137,984 | $107,016 |
| 2016 | $1,614 | $118,800 | $58,239 | $60,561 |
| 2015 | $1,585 | $110,110 | $58,239 | $51,871 |
| 2014 | $509 | $110,375 | $58,239 | $52,136 |
| 2013 | -- | $100,104 | $43,945 | $56,159 |
Source: Public Records
Map
Nearby Homes
- 49 E 200 N Unit 4
- 41 E 200 N Unit 6
- 55 E 200 N Unit 2
- 51 E 200 N Unit 3
- 254 N Main St
- 256 N Main St
- 252 N Main St
- 17 E 400 N Unit 19B
- 453 N 400 E Unit 7-D
- 320 N 200 W Unit 4
- 513 N 400 E Unit 14B
- 332 N 300 W
- 357 S 100 E
- 499 N 200 W Unit 30
- 499 N 200 W Unit 19
- 75 N Peregrine Ln W Unit 8
- 32 W 400 S
- 34 W 400 S
- 255 E 400 S
- 563 N 200 W
Your Personal Tour Guide
Ask me questions while you tour the home.