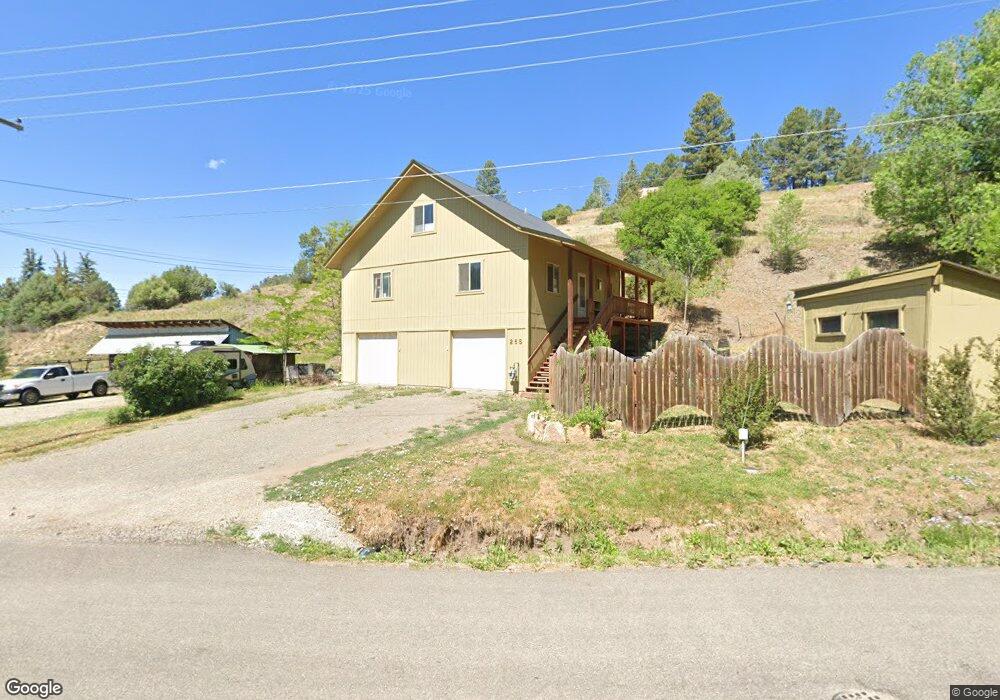
265 N 2nd St Pagosa Springs, CO 81147
Estimated Value: $579,865 - $807,000
3
Beds
2
Baths
1,632
Sq Ft
$412/Sq Ft
Est. Value
About This Home
This home is located at 265 N 2nd St, Pagosa Springs, CO 81147 and is currently estimated at $672,966, approximately $412 per square foot. 265 N 2nd St is a home with nearby schools including Pagosa Springs Elementary School, Pagosa Springs Middle School, and Pagosa Springs High School.
Ownership History
Date
Name
Owned For
Owner Type
Purchase Details
Closed on
Aug 10, 2018
Sold by
Dickhoff Nancy A
Bought by
Dickhoff James E
Current Estimated Value
Purchase Details
Closed on
Mar 31, 2000
Sold by
Iverson Timothy S and Iverson Susan K
Bought by
Dickhoff James E and Dickhoff Nancy A
Purchase Details
Closed on
Oct 2, 1996
Sold by
Paws
Bought by
Iverson Tim and Iverson Susan
Purchase Details
Closed on
Feb 7, 1996
Sold by
Iverson Sherwon W and Iverson Shirley E
Bought by
Iverson Timothy S and Iverson Susan K
Purchase Details
Closed on
Nov 9, 1994
Sold by
Lavarta Carlos T
Bought by
Iverson Sherwin W and Iverson Shirley E
Purchase Details
Closed on
Jun 2, 1994
Sold by
Lavarta Carlos T
Bought by
La Varta Carlos T Estate
Purchase Details
Closed on
Jan 14, 1994
Sold by
Lavarta Carlos T and Lavarta Virginia
Bought by
Lavarta Carlos T
Purchase Details
Closed on
Jul 1, 1973
Bought by
Lavarta Carlos T and Lavarta Virginia
Create a Home Valuation Report for This Property
The Home Valuation Report is an in-depth analysis detailing your home's value as well as a comparison with similar homes in the area
Home Values in the Area
Average Home Value in this Area
Purchase History
| Date | Buyer | Sale Price | Title Company |
|---|---|---|---|
| Dickhoff James E | $70,000 | None Available | |
| Dickhoff James E | $164,000 | -- | |
| Iverson Tim | -- | -- | |
| Iverson Timothy S | $12,000 | -- | |
| Iverson Sherwin W | -- | -- | |
| La Varta Carlos T Estate | -- | -- | |
| Lavarta Carlos T | -- | -- | |
| Lavarta Carlos T | $2,000 | -- |
Source: Public Records
Tax History Compared to Growth
Tax History
| Year | Tax Paid | Tax Assessment Tax Assessment Total Assessment is a certain percentage of the fair market value that is determined by local assessors to be the total taxable value of land and additions on the property. | Land | Improvement |
|---|---|---|---|---|
| 2024 | $2,288 | $37,840 | $12,090 | $25,750 |
| 2023 | $2,288 | $37,840 | $12,090 | $25,750 |
| 2022 | $1,444 | $22,600 | $5,440 | $17,160 |
| 2021 | $1,567 | $24,120 | $5,720 | $18,400 |
| 2020 | $1,479 | $22,630 | $4,860 | $17,770 |
| 2019 | $1,460 | $22,630 | $4,860 | $17,770 |
| 2018 | $1,360 | $19,380 | $3,330 | $16,050 |
| 2017 | $1,179 | $19,380 | $3,330 | $16,050 |
| 2016 | $952 | $15,500 | $2,820 | $12,680 |
| 2015 | -- | $15,500 | $2,820 | $12,680 |
| 2014 | -- | $11,940 | $2,820 | $9,120 |
Source: Public Records
Map
Nearby Homes