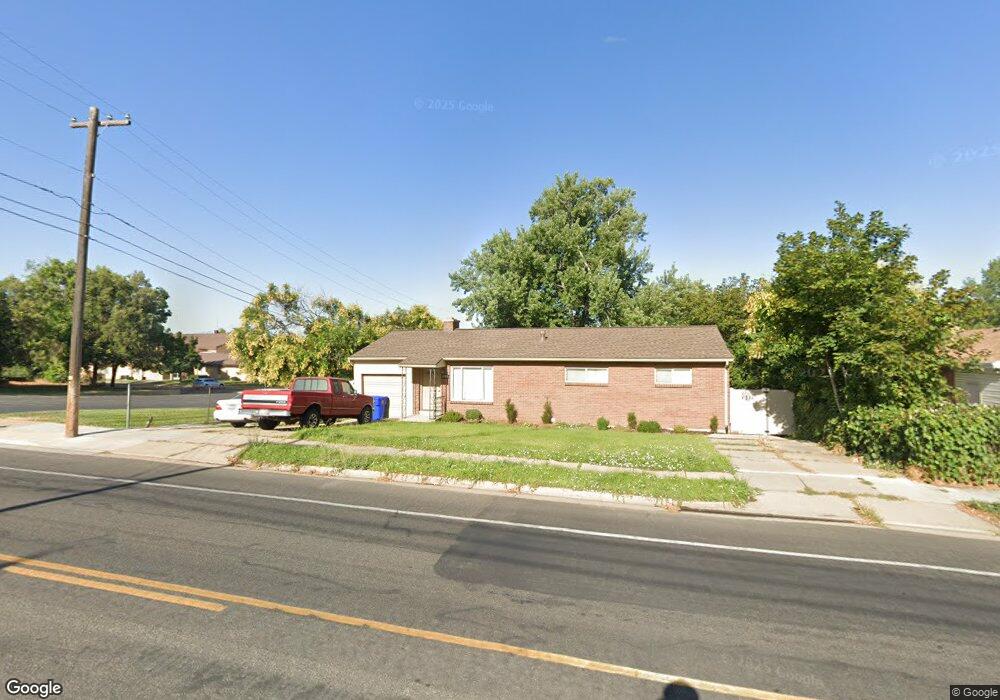
265 N 400 E Centerville, UT 84014
Estimated Value: $494,000 - $603,000
4
Beds
2
Baths
2,392
Sq Ft
$229/Sq Ft
Est. Value
About This Home
This home is located at 265 N 400 E, Centerville, UT 84014 and is currently estimated at $548,351, approximately $229 per square foot. 265 N 400 E is a home located in Davis County with nearby schools including Centerville Elementary, Centerville Jr High, and Viewmont High School.
Ownership History
Date
Name
Owned For
Owner Type
Purchase Details
Closed on
May 1, 2019
Sold by
Koller Jeffrey A
Bought by
Cluff Kendall
Current Estimated Value
Home Financials for this Owner
Home Financials are based on the most recent Mortgage that was taken out on this home.
Original Mortgage
$302,640
Outstanding Balance
$265,533
Interest Rate
4.2%
Mortgage Type
New Conventional
Estimated Equity
$282,818
Purchase Details
Closed on
Jun 26, 2014
Sold by
Thompson Matthew C
Bought by
Koller Jeffrey A
Home Financials for this Owner
Home Financials are based on the most recent Mortgage that was taken out on this home.
Original Mortgage
$231,725
Interest Rate
4.25%
Mortgage Type
FHA
Purchase Details
Closed on
Feb 3, 2012
Sold by
Thompson Matthew C and Thompson Britney B
Bought by
Thompson Matthew C
Home Financials for this Owner
Home Financials are based on the most recent Mortgage that was taken out on this home.
Original Mortgage
$186,172
Interest Rate
4.4%
Mortgage Type
FHA
Purchase Details
Closed on
Jun 11, 2007
Sold by
Thompson Douglas P and Thompson Cheryl C
Bought by
Thompson Matthew C and Thompson Britney B
Home Financials for this Owner
Home Financials are based on the most recent Mortgage that was taken out on this home.
Original Mortgage
$180,000
Interest Rate
6.14%
Mortgage Type
New Conventional
Purchase Details
Closed on
Apr 19, 2007
Sold by
Thompson Douglas P and Thompson Cheryl C
Bought by
Thompson Douglas P and Thompson Cheryl C
Home Financials for this Owner
Home Financials are based on the most recent Mortgage that was taken out on this home.
Original Mortgage
$180,000
Interest Rate
6.14%
Mortgage Type
New Conventional
Purchase Details
Closed on
Oct 7, 2002
Sold by
Thompson Cherish
Bought by
Thompson Matthew C
Home Financials for this Owner
Home Financials are based on the most recent Mortgage that was taken out on this home.
Original Mortgage
$146,000
Interest Rate
6.22%
Purchase Details
Closed on
Oct 1, 2002
Sold by
Thompson Douglas Paul and Thompson Cheryl C
Bought by
Thompson Douglas P and Thompson Cheryl C
Home Financials for this Owner
Home Financials are based on the most recent Mortgage that was taken out on this home.
Original Mortgage
$146,000
Interest Rate
6.22%
Purchase Details
Closed on
Jun 4, 2002
Sold by
Thompson Cherish C
Bought by
Thompson Douglas Paul and Thompson Cheryl C
Purchase Details
Closed on
Feb 17, 1999
Sold by
Thompson Douglas Paul and Thompson Cheryl C
Bought by
Thompson Douglas Paul and Thompson Cheryl C
Create a Home Valuation Report for This Property
The Home Valuation Report is an in-depth analysis detailing your home's value as well as a comparison with similar homes in the area
Purchase History
| Date | Buyer | Sale Price | Title Company |
|---|---|---|---|
| Cluff Kendall | -- | Us Title Company | |
| Koller Jeffrey A | -- | Magellan Title | |
| Thompson Matthew C | -- | Advanced Title Ins A | |
| Thompson Matthew C | -- | Bonneville Superior Title Co | |
| Thompson Douglas P | -- | Bonneville Superior Title Co | |
| Thompson Matthew C | -- | Backman Stewart Title Servic | |
| Thompson Douglas P | -- | Backman Stewart Title Svcs | |
| Thompson Douglas Paul | -- | -- | |
| Thompson Douglas Paul | -- | Backman Stewart Title Servic |
Source: Public Records
Mortgage History
| Date | Status | Borrower | Loan Amount |
|---|---|---|---|
| Open | Cluff Kendall | $302,640 | |
| Previous Owner | Koller Jeffrey A | $231,725 | |
| Previous Owner | Thompson Matthew C | $186,172 | |
| Previous Owner | Thompson Matthew C | $180,000 | |
| Previous Owner | Thompson Douglas P | $146,000 |
Source: Public Records
Tax History
| Year | Tax Paid | Tax Assessment Tax Assessment Total Assessment is a certain percentage of the fair market value that is determined by local assessors to be the total taxable value of land and additions on the property. | Land | Improvement |
|---|---|---|---|---|
| 2025 | $3,085 | $277,200 | $164,837 | $112,363 |
| 2024 | $2,926 | $271,150 | $148,515 | $122,635 |
| 2023 | $2,858 | $478,000 | $243,145 | $234,855 |
| 2022 | $2,863 | $277,200 | $122,870 | $154,330 |
| 2021 | $2,649 | $365,000 | $188,009 | $176,991 |
| 2020 | $1,917 | $289,000 | $183,417 | $105,583 |
| 2019 | $1,902 | $280,000 | $183,871 | $96,129 |
| 2018 | $1,760 | $256,000 | $170,547 | $85,453 |
| 2016 | $1,448 | $117,095 | $57,908 | $59,187 |
| 2015 | $1,421 | $108,350 | $57,908 | $50,442 |
| 2014 | $1,506 | $117,551 | $57,908 | $59,643 |
| 2013 | -- | $97,434 | $44,204 | $53,230 |
Source: Public Records
Map
Nearby Homes
Your Personal Tour Guide
Ask me questions while you tour the home.