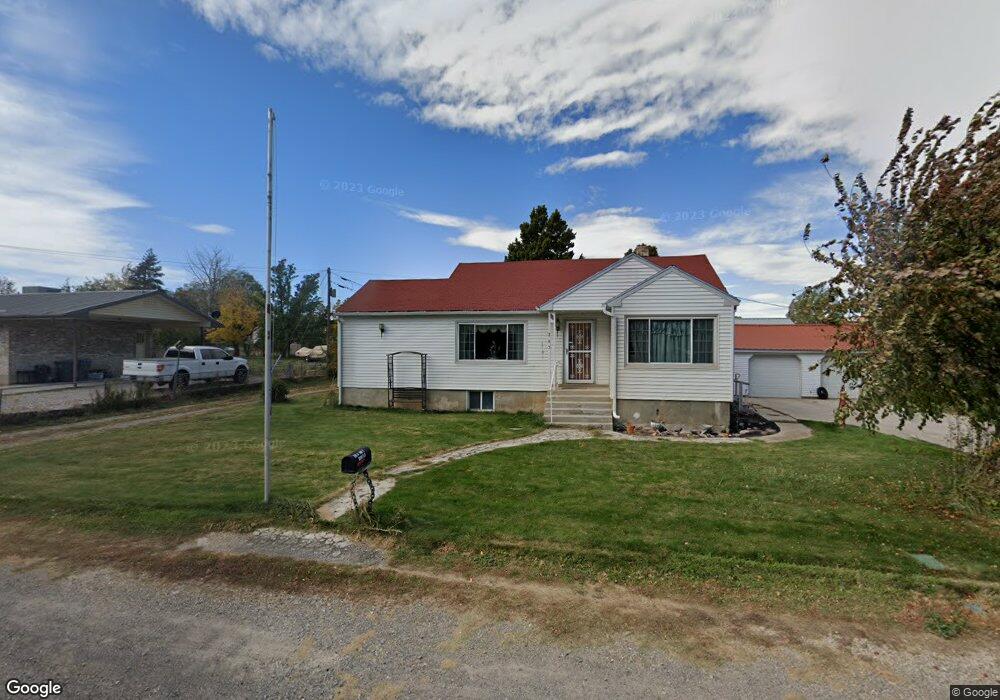
265 N 400 E Santaquin, UT 84655
Estimated Value: $455,000 - $554,830
4
Beds
1
Bath
1,186
Sq Ft
$415/Sq Ft
Est. Value
About This Home
This home is located at 265 N 400 E, Santaquin, UT 84655 and is currently estimated at $491,610, approximately $414 per square foot. 265 N 400 E is a home located in Utah County with nearby schools including Apple Valley Elementary, Payson Junior High School, and Mt. Nebo Middle.
Ownership History
Date
Name
Owned For
Owner Type
Purchase Details
Closed on
Apr 23, 2025
Sold by
Hamilton Boyd T and Hamilton Debbie A
Bought by
Boyd T Hamilton And Debbie A Hamilton Revocab and Hamilton
Current Estimated Value
Purchase Details
Closed on
Oct 4, 2013
Sold by
Hamilton Boyd T and Hamilton Debbie A
Bought by
Hamilton Boyd T and Hamilton Debbie A
Purchase Details
Closed on
Dec 30, 2008
Sold by
Hamilton Boyd
Bought by
Hamilton Boyd T and Hamilton Debbie A
Create a Home Valuation Report for This Property
The Home Valuation Report is an in-depth analysis detailing your home's value as well as a comparison with similar homes in the area
Home Values in the Area
Average Home Value in this Area
Purchase History
| Date | Buyer | Sale Price | Title Company |
|---|---|---|---|
| Boyd T Hamilton And Debbie A Hamilton Revocab | -- | None Listed On Document | |
| Hamilton Boyd T | -- | First American Title Co Llc | |
| Hamilton Boyd T | -- | First American Title Co Llc | |
| Hamilton Boyd T | -- | None Available |
Source: Public Records
Tax History
| Year | Tax Paid | Tax Assessment Tax Assessment Total Assessment is a certain percentage of the fair market value that is determined by local assessors to be the total taxable value of land and additions on the property. | Land | Improvement |
|---|---|---|---|---|
| 2025 | $1,968 | $223,795 | -- | -- |
| 2024 | $1,968 | $195,965 | $0 | $0 |
| 2023 | $1,938 | $193,655 | $0 | $0 |
| 2022 | $2,001 | $206,140 | $0 | $0 |
| 2021 | $1,631 | $260,500 | $98,000 | $162,500 |
| 2020 | $1,545 | $239,200 | $85,200 | $154,000 |
| 2019 | $1,355 | $214,400 | $80,500 | $133,900 |
| 2018 | $1,273 | $192,100 | $75,700 | $116,400 |
| 2017 | $1,310 | $105,655 | $0 | $0 |
| 2016 | $1,206 | $95,260 | $0 | $0 |
| 2015 | $1,108 | $85,855 | $0 | $0 |
| 2014 | $1,010 | $78,100 | $0 | $0 |
Source: Public Records
Map
Nearby Homes
Your Personal Tour Guide
Ask me questions while you tour the home.