Estimated Value: $416,000 - $461,000
4
Beds
3
Baths
1,748
Sq Ft
$248/Sq Ft
Est. Value
About This Home
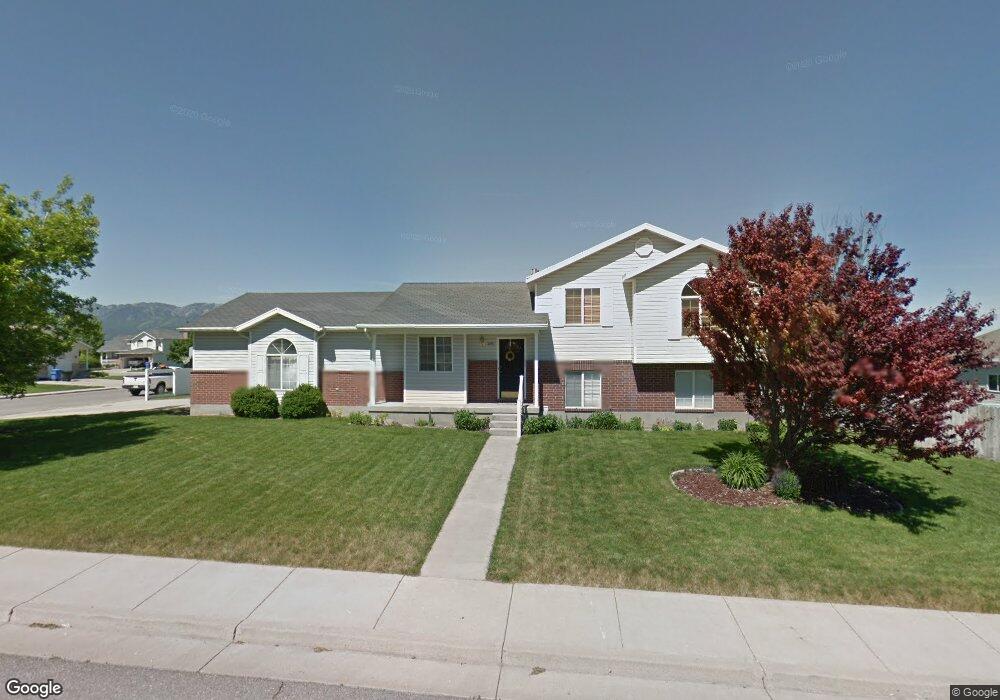
This home is located at 265 N 825 W, Hyrum, UT 84319 and is currently estimated at $433,873, approximately $248 per square foot. 265 N 825 W is a home located in Cache County with nearby schools including Lincoln School, South Cache Middle School, and Mountain Crest High School.
Ownership History
Date
Name
Owned For
Owner Type
Purchase Details
Closed on
Aug 23, 2018
Sold by
Jensen Brian Jay and Jensen Ada Ann
Bought by
Jensen Brian Jay and Jensen Ada Ann
Current Estimated Value
Purchase Details
Closed on
Nov 17, 2014
Sold by
Morgan Sandra Cook
Bought by
Morgan Andrew Allan and Morgan Sandra Cook
Purchase Details
Closed on
Feb 22, 2010
Sold by
Morgan Andrew A and Morgan Sandra C
Bought by
Morgan Sandra C
Home Financials for this Owner
Home Financials are based on the most recent Mortgage that was taken out on this home.
Original Mortgage
$117,500
Interest Rate
5.03%
Mortgage Type
New Conventional
Purchase Details
Closed on
Apr 23, 2001
Sold by
Brown Timothy F and Brown Denae L
Bought by
Brown Cody T and Brown Christy L
Home Financials for this Owner
Home Financials are based on the most recent Mortgage that was taken out on this home.
Original Mortgage
$121,000
Interest Rate
6.98%
Create a Home Valuation Report for This Property
The Home Valuation Report is an in-depth analysis detailing your home's value as well as a comparison with similar homes in the area
Home Values in the Area
Average Home Value in this Area
Purchase History
| Date | Buyer | Sale Price | Title Company |
|---|---|---|---|
| Jensen Brian Jay | -- | None Available | |
| Morgan Andrew Allan | -- | None Available | |
| Morgan Sandra C | -- | Northern Title Company | |
| Morgan Andrew A | -- | Northern Title Company | |
| Brown Cody T | -- | American Secure Title |
Source: Public Records
Mortgage History
| Date | Status | Borrower | Loan Amount |
|---|---|---|---|
| Closed | Morgan Andrew A | $117,500 | |
| Closed | Brown Cody T | $121,000 |
Source: Public Records
Tax History Compared to Growth
Tax History
| Year | Tax Paid | Tax Assessment Tax Assessment Total Assessment is a certain percentage of the fair market value that is determined by local assessors to be the total taxable value of land and additions on the property. | Land | Improvement |
|---|---|---|---|---|
| 2025 | $1,487 | $213,555 | $0 | $0 |
| 2024 | $1,434 | $192,320 | $0 | $0 |
| 2023 | $1,420 | $182,000 | $0 | $0 |
| 2022 | $1,481 | $182,000 | $0 | $0 |
| 2021 | $1,467 | $277,730 | $65,000 | $212,730 |
| 2020 | $1,260 | $223,884 | $65,000 | $158,884 |
| 2019 | $1,190 | $198,884 | $40,000 | $158,884 |
| 2018 | $1,103 | $178,160 | $40,000 | $138,160 |
| 2017 | $1,087 | $91,080 | $0 | $0 |
| 2016 | $1,111 | $91,080 | $0 | $0 |
| 2015 | $926 | $75,710 | $0 | $0 |
| 2014 | $938 | $78,460 | $0 | $0 |
| 2013 | -- | $78,460 | $0 | $0 |
Source: Public Records
Map
Nearby Homes
- 840 W 250 N
- 835 W Highway 101
- 845 W 300 N
- 260 N 825 W
- 827 W 250 N
- 242 N 850 W
- 830 250 N Unit 27
- 823 250 N Unit 1
- 825 W Highway 101
- 815 W 250 N
- 860 W 250 N Unit 25
- 865 W 300 N
- 770 W 250 N Unit 2
- 230 N 850 W
- 245 N 850 W Unit 24
- 225 N 800 W
- 805 W Highway 101
- 777 W 250 N Unit 28
- 244 N 800 W
- 875 W Highway 101